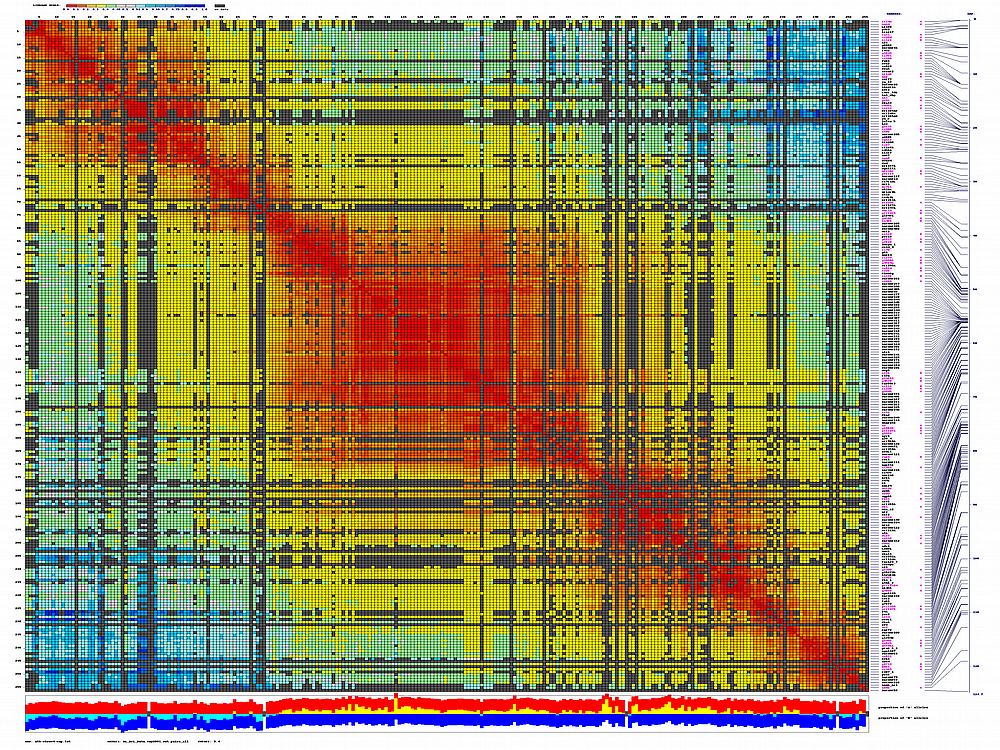
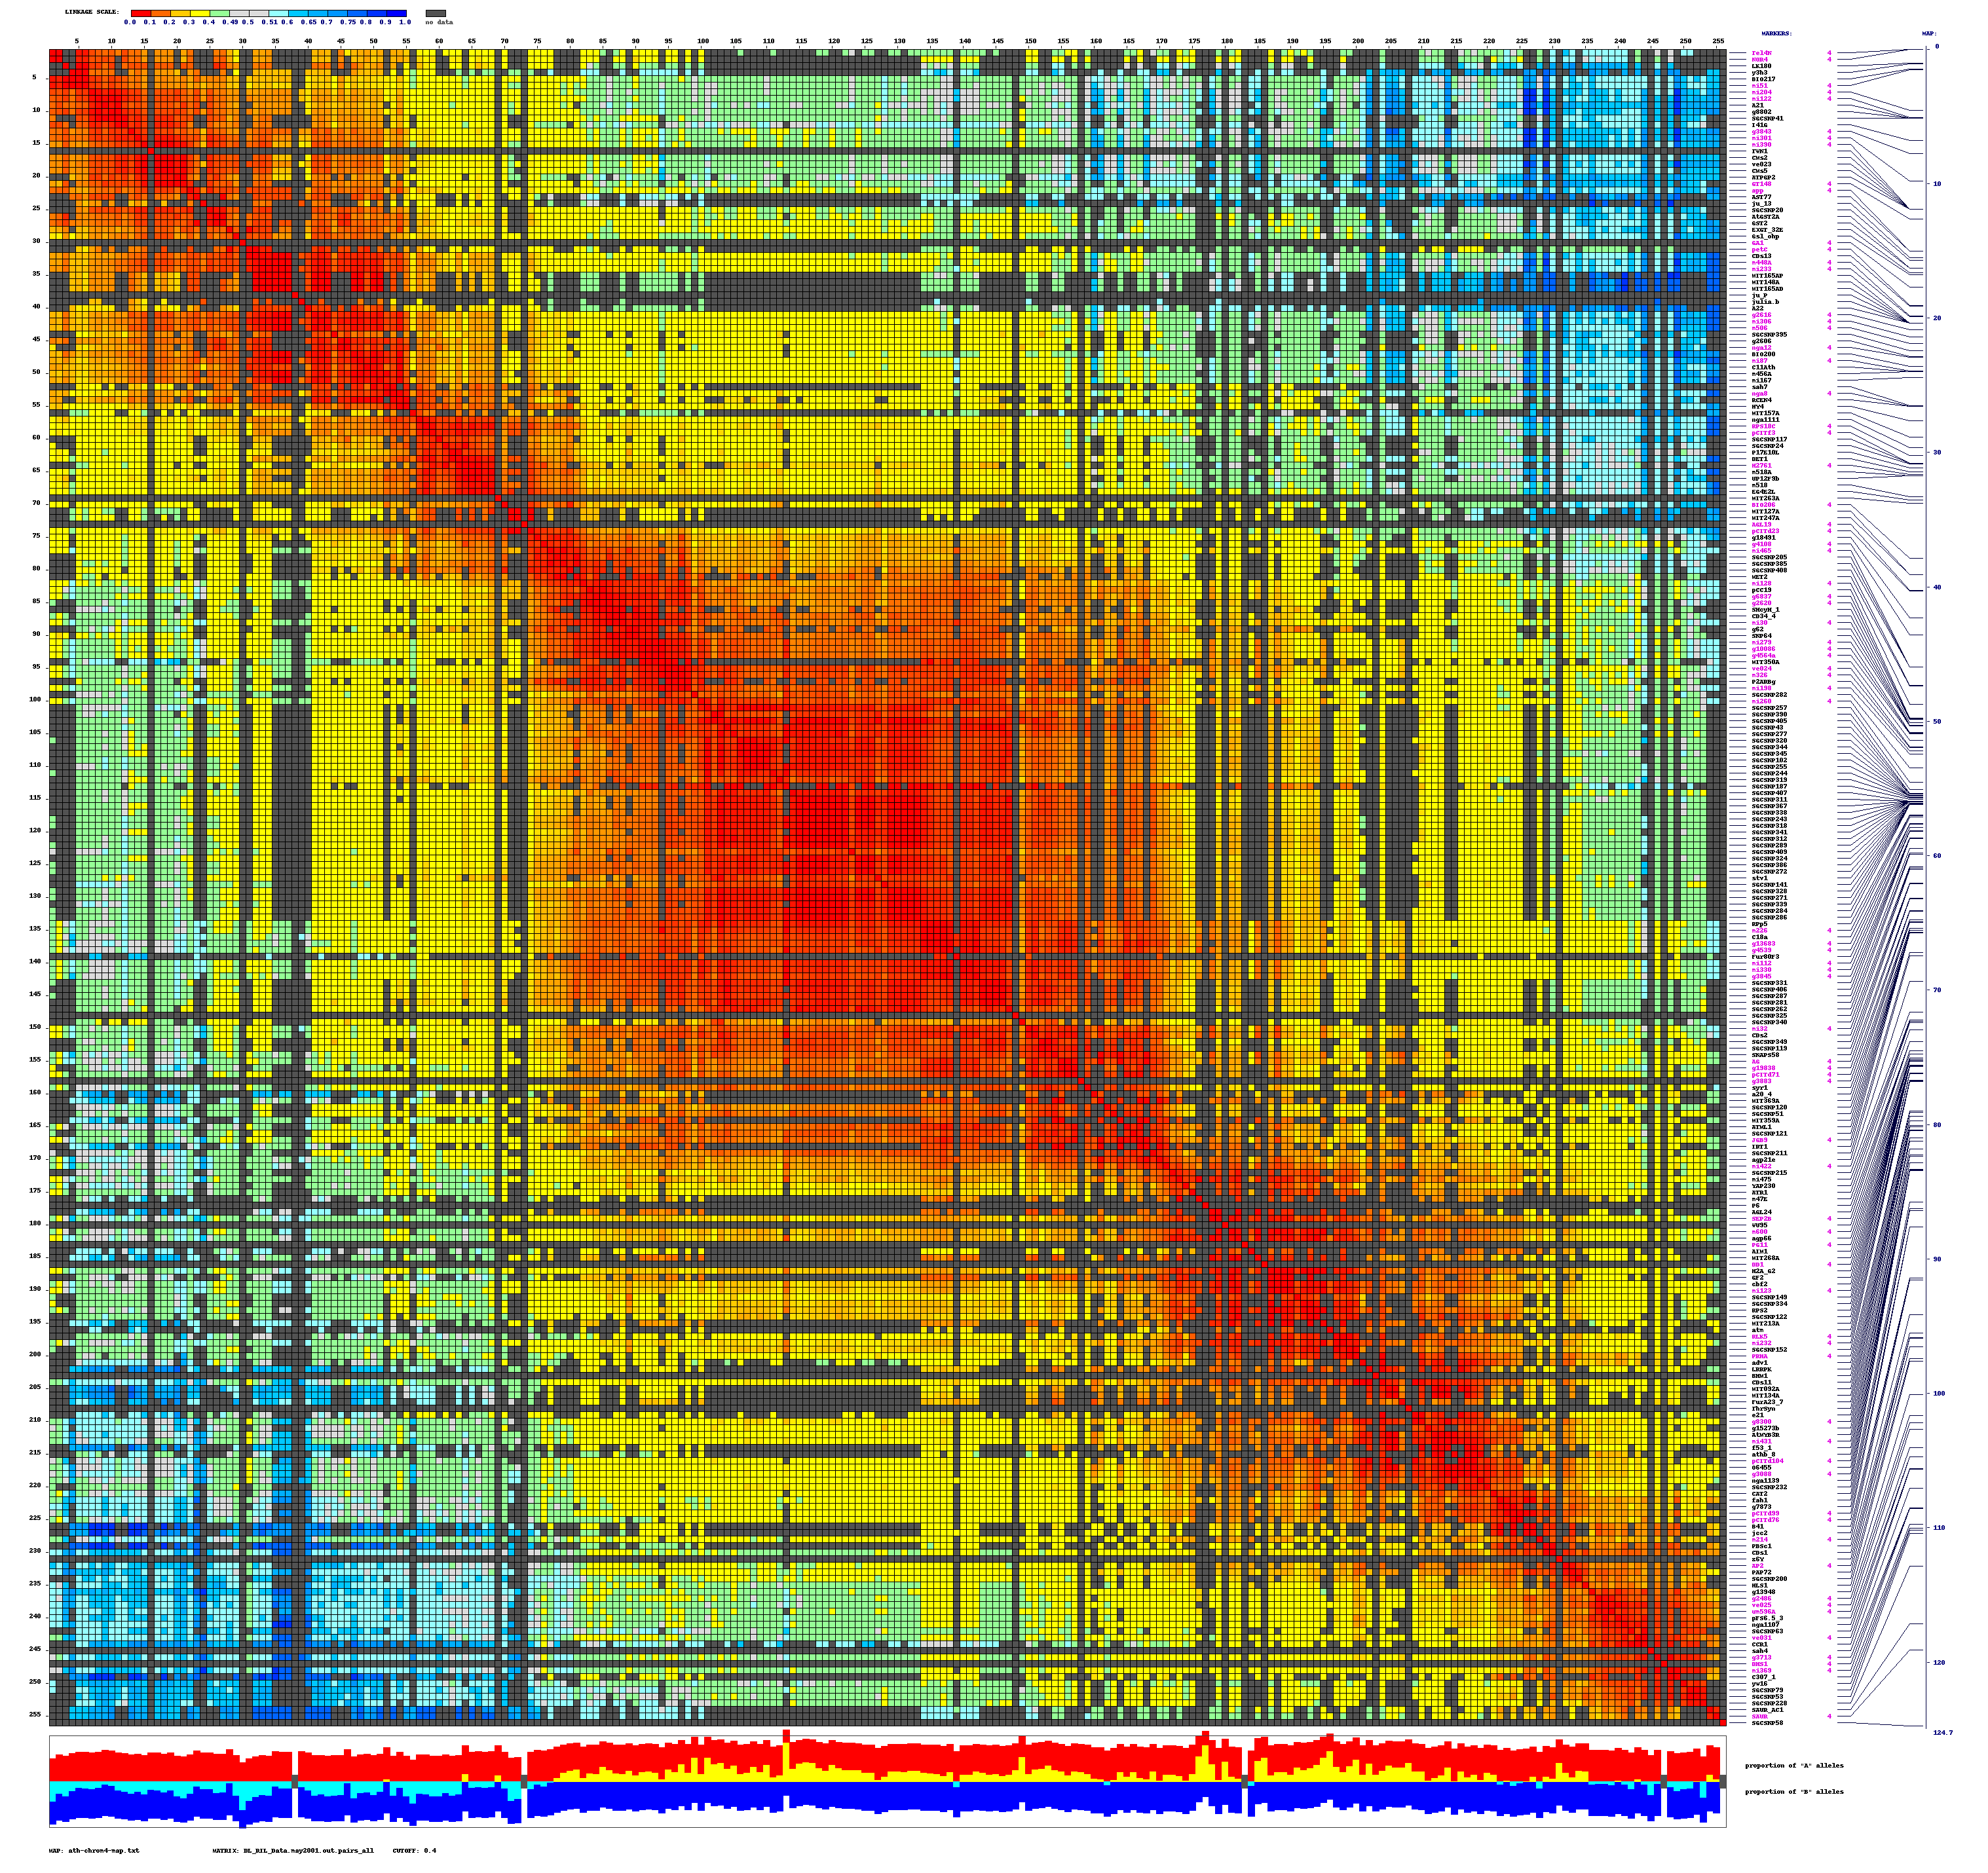
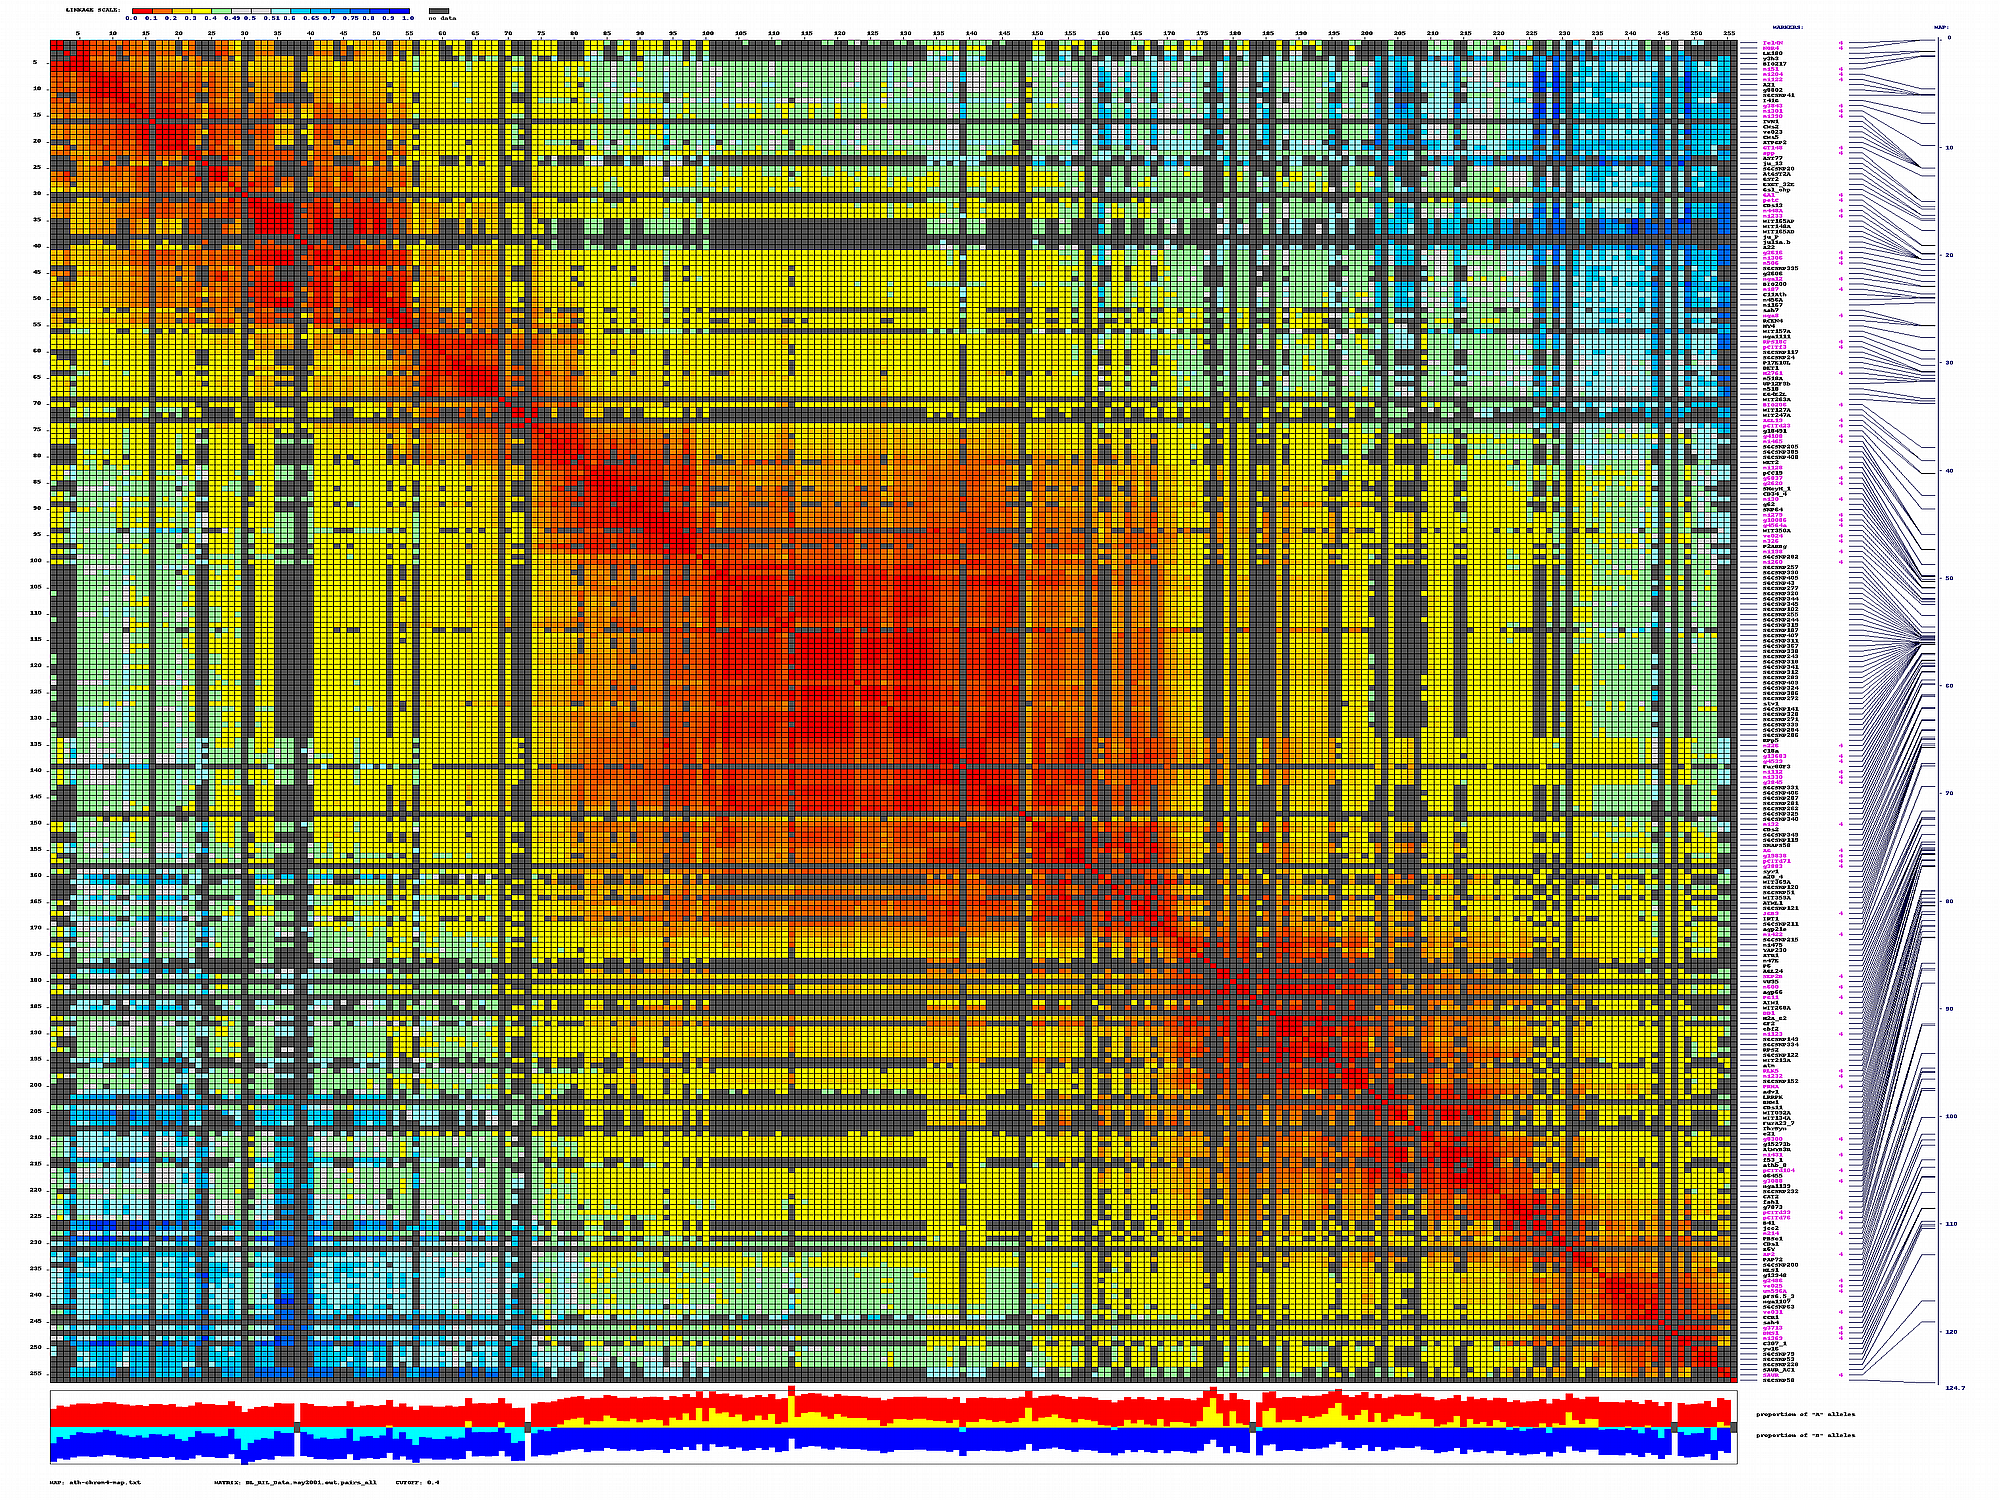
py_matrix_2D_V248_RECBIT.py takes as input matrix file,
map file and three optional files: framework markers list,
list of IDs to highlight in red and *.loc file with recombination data (raw marker scores).
if user provides framework markers list (map of framework markers) then
these markers will be painted in purple on 2D plot.
if user provides list of IDs to highlight in red then
these markers will be painted in red on 2D plot (we use it to highlight new markers on a map).
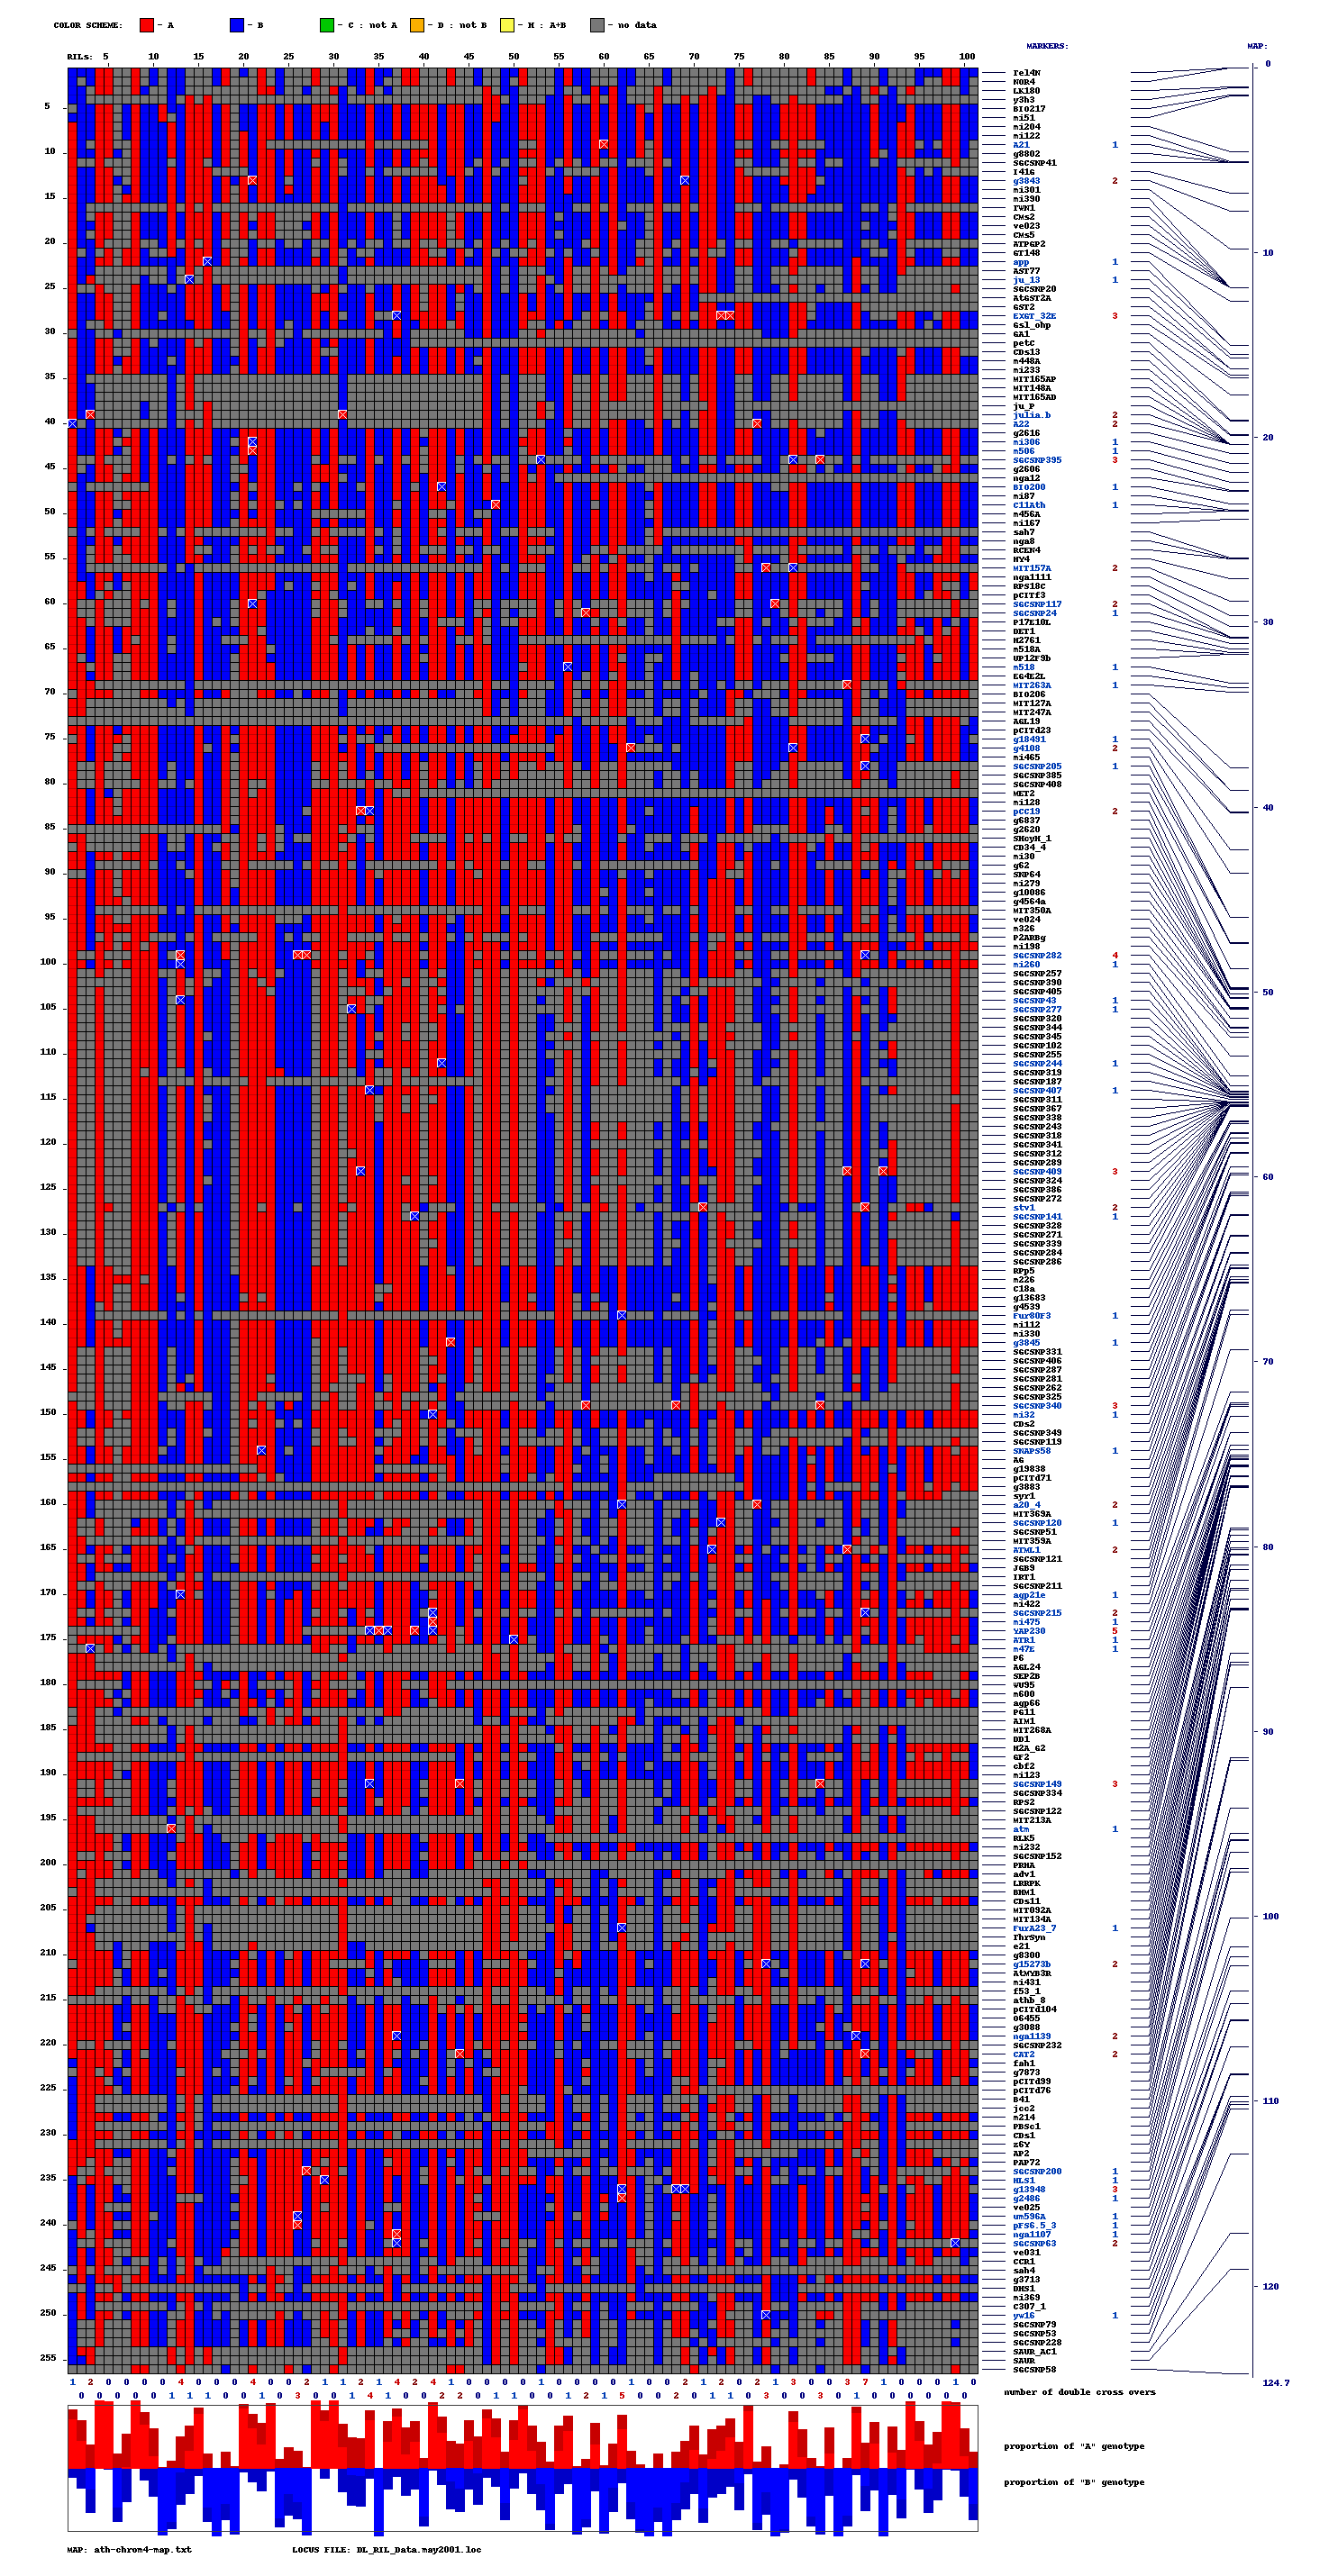
if user provides *.loc file with recombination scores (raw data for markers and RILs) then
allele composition plot will be generated on the bottom of image.
Program usage (program reads 11 arguments in the following order):
[matrix_file] [map_file] [output_file] [frame_marker_list] [red_list] [loc_file] [REC/BIT/LOD] [GRAPH_OPT] [LINK_CUT] [LARGE/SMALL] [RIL_TYPE]
frame_marker_list is optional, if you do not have it just type X
red_list is a list of markers to highlight in red
red_list is optional, if you do not have it just type Y
loc_file is optional, if you do not have it just type Z
-------------------------------------------------------
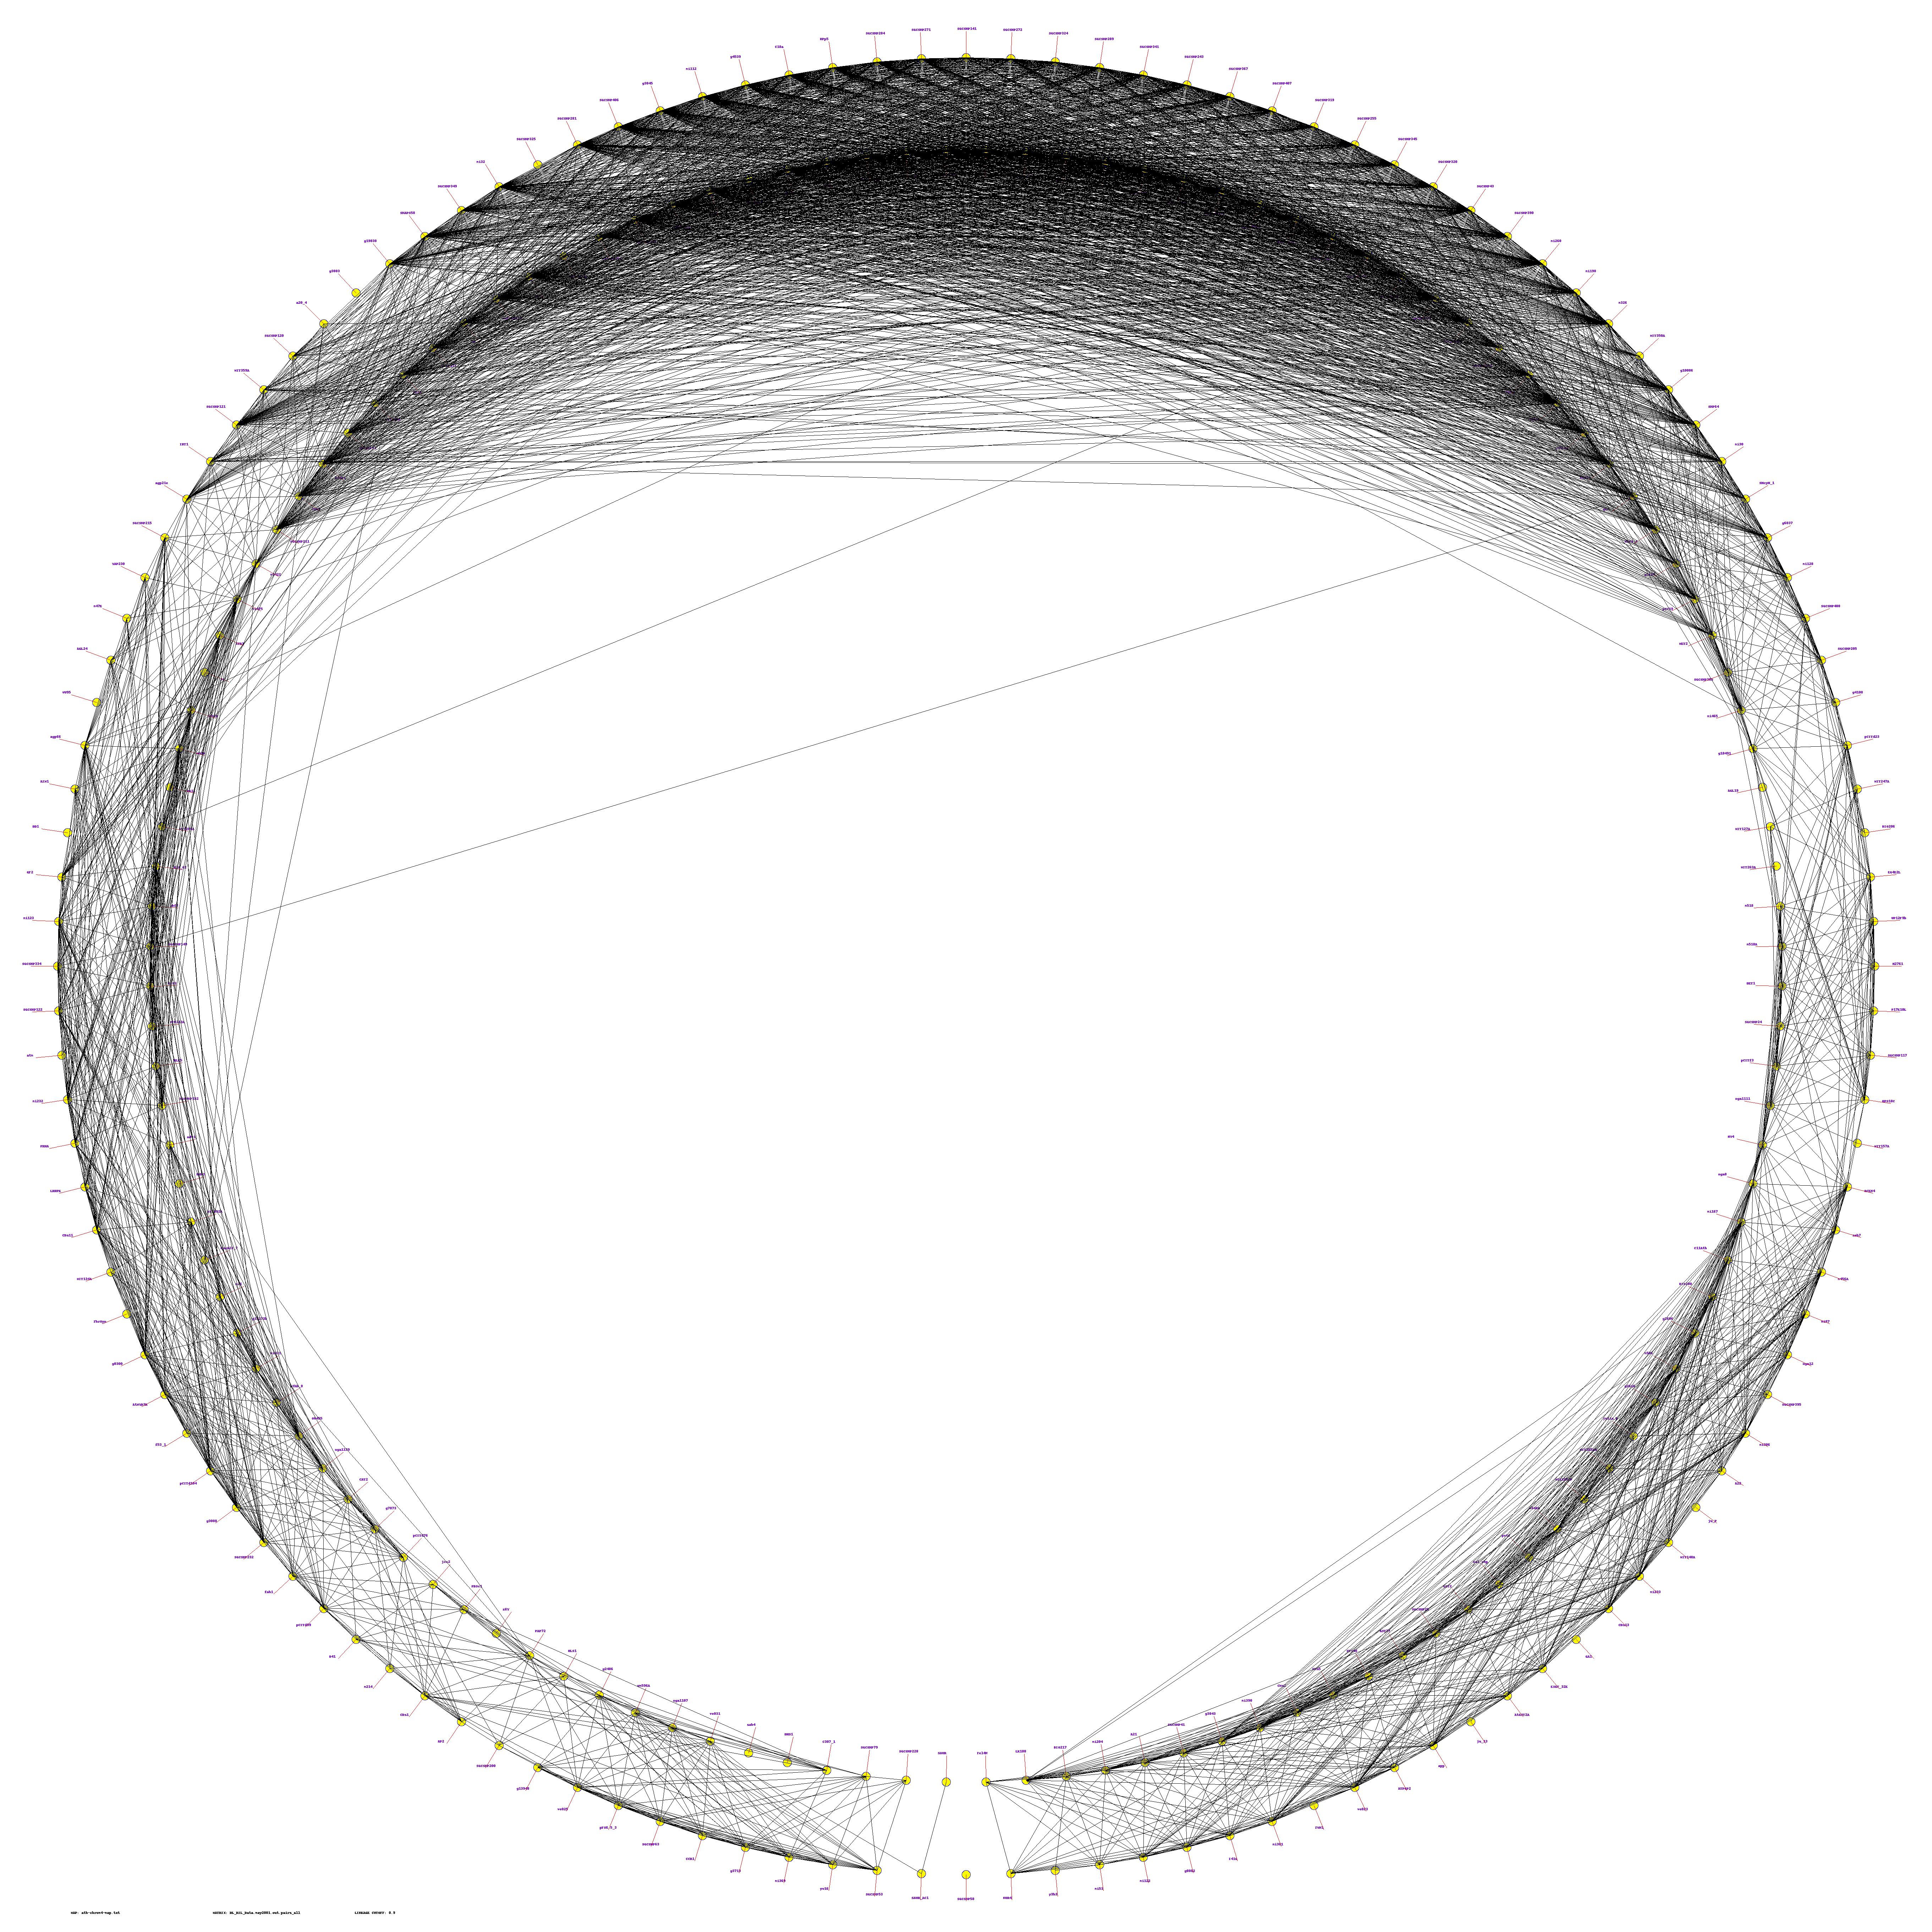
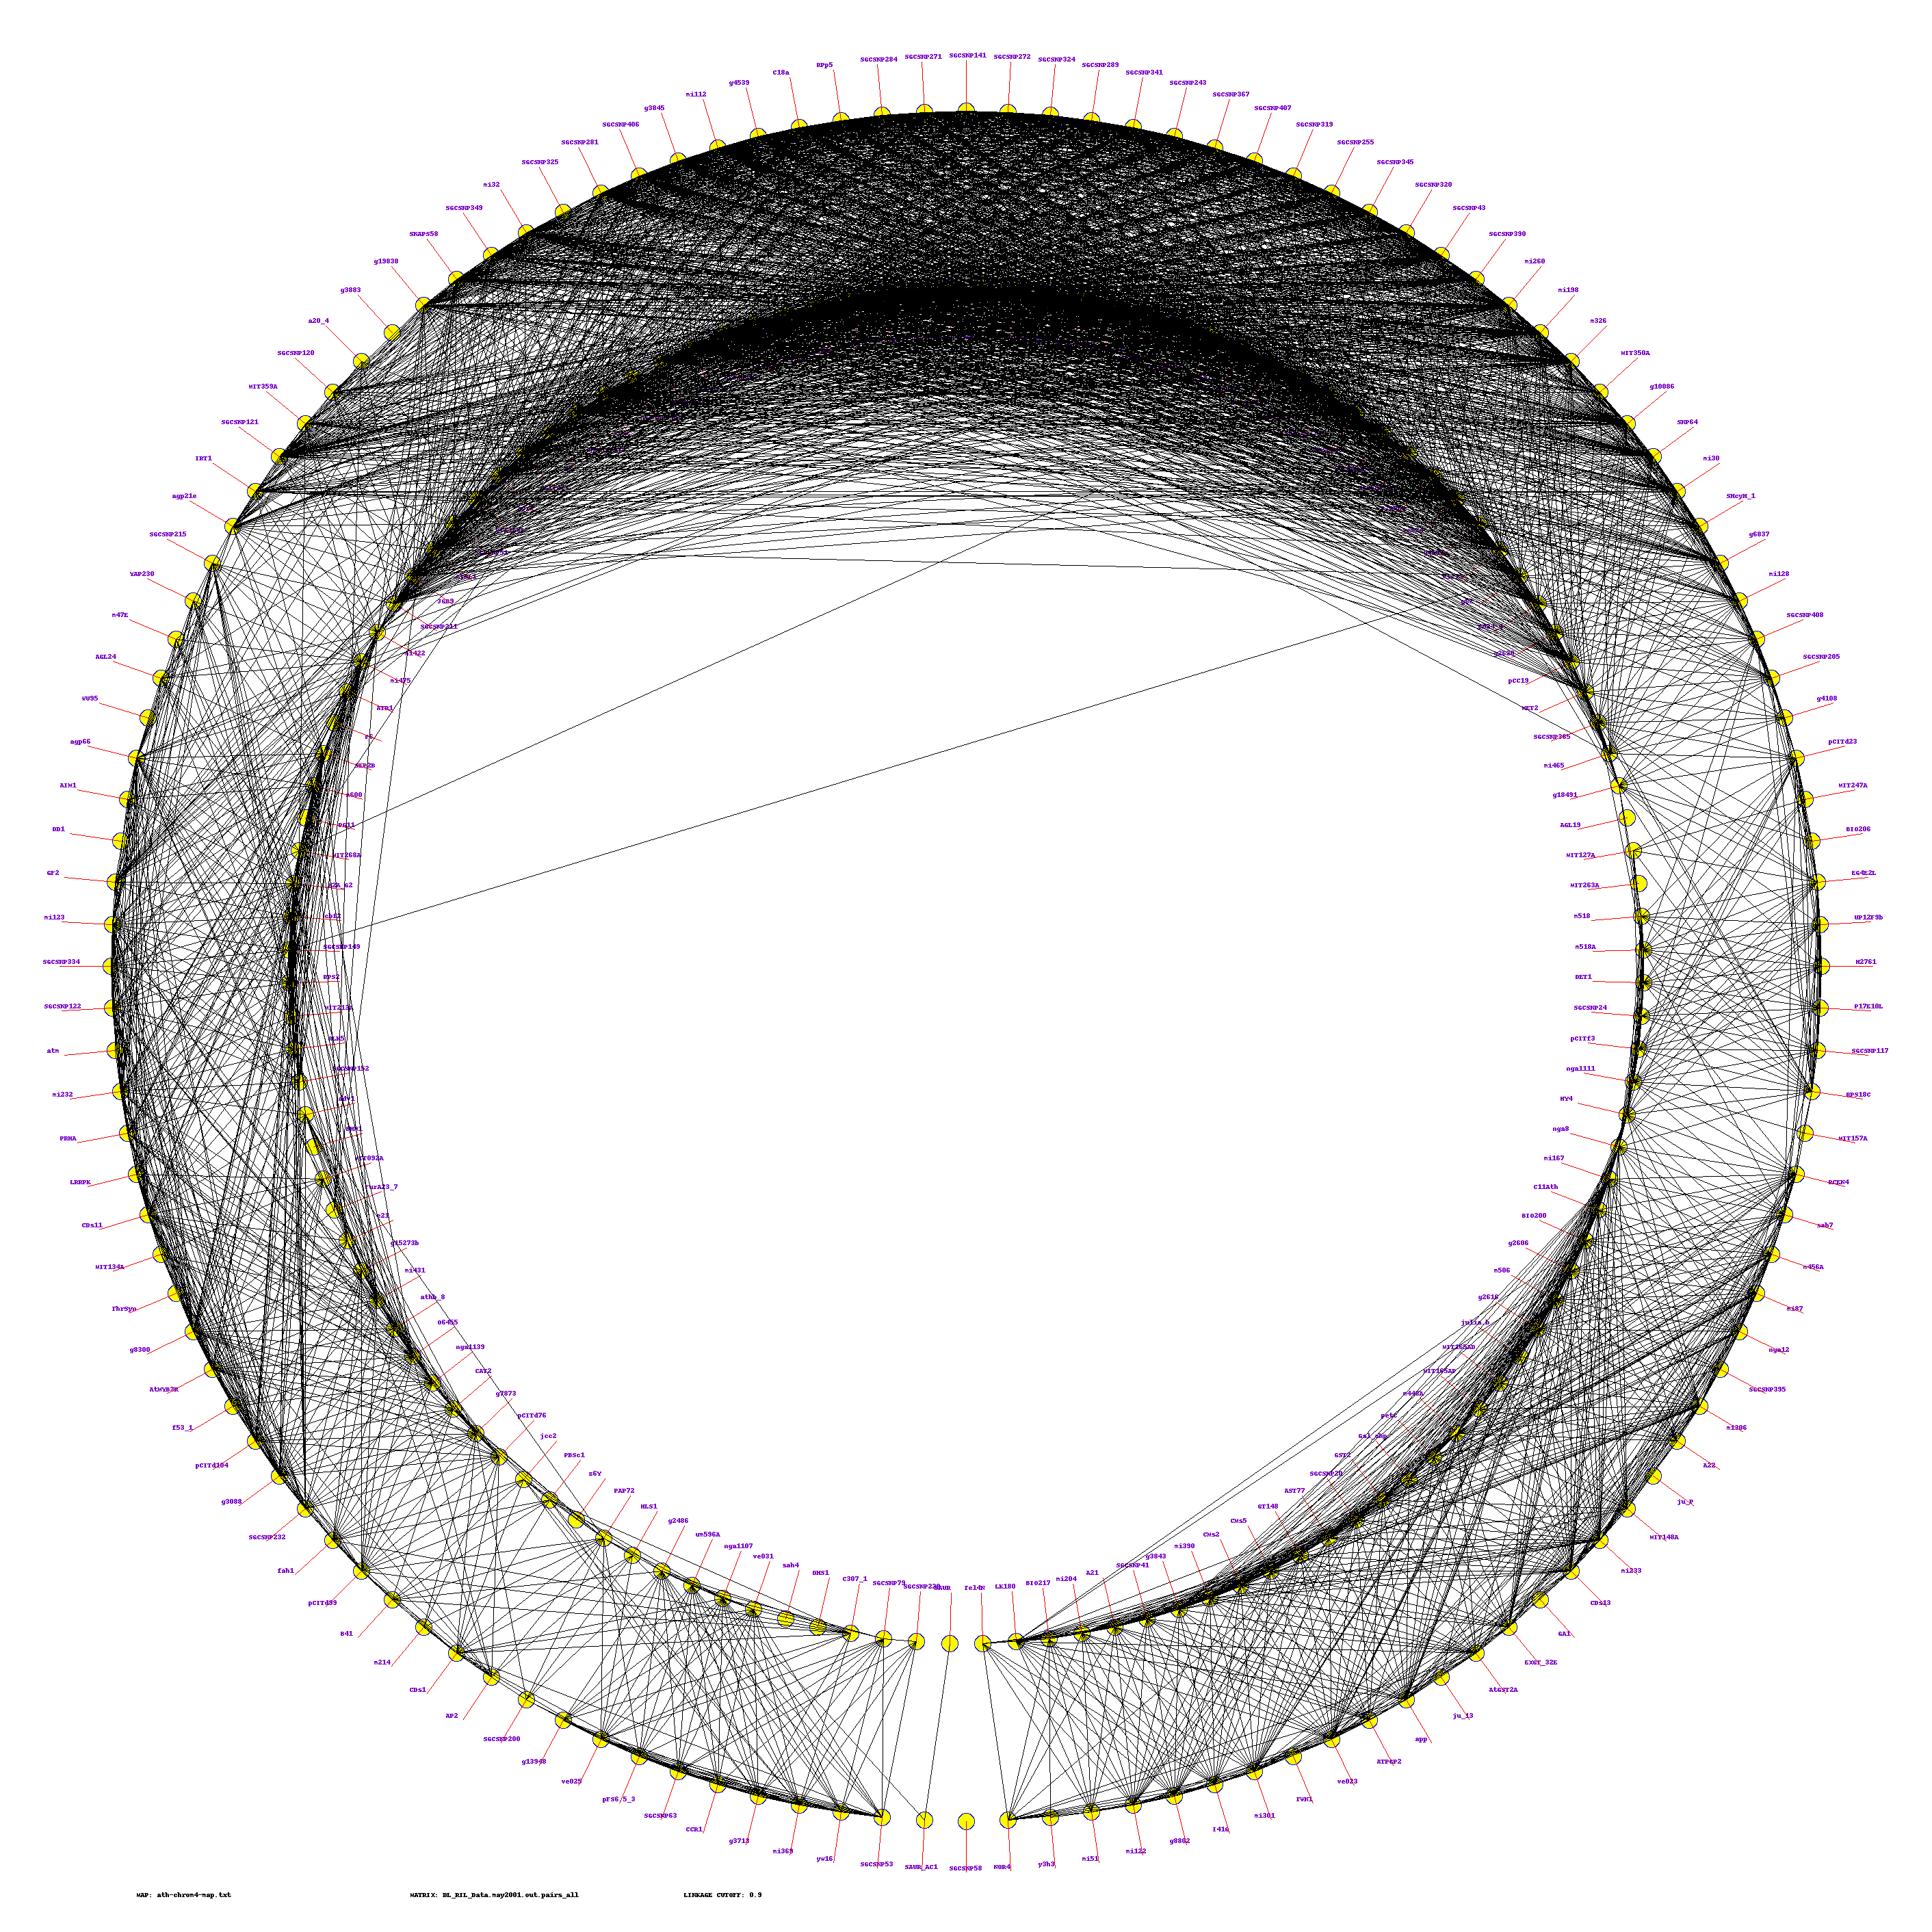
GRAPH/NOGRAPH option - if 8-th option is "GRAPH" then CIRCULAR graph will be generated
LINK_CUT - linkage cutoff value on circular graph (0.9 - 0.8)
generation of circular graph needs lot of computer memory
do not use it for set of markers larger than 1000
-------------------------------------------------------
LARGE/SMALL option - how many pixels per cell. LARGE - 10 pixels, SMALL - 6 pixels
use SMALL option for large datasets - more than 1000 markers
-------------------------------------------------------
RIL type must be "RIL" or "F2"
For example, for Arabidopsis chromosome 4 we can execute:
$python py_matrix_2D_V248_RECBIT.py DL_RIL_Data.may2001.out.pairs_all ath-chrom4-map.txt ath-chrom4-map.out246.rec Dean_Lister_frame.IDs Y DL_RIL_Data.may2001.loc REC GRAPH 0.9 LARGE RIL
where:
DL_RIL_Data.may2001.out.pairs_all - matrix file (53 Mb)
ath-chrom4-map.txt - map file
ath-chrom4-map.out246.rec - output file(s)
Dean_Lister_frame.IDs - map containing framework markers only
Y - we do not use list of markers to highlight them in red color
DL_RIL_Data.may2001.loc - *.loc file with recombination data
(raw marker scores)
REC - "REC" option which tells to program generate image with REC (recombination) score
GRAPH - circular graph will be generated
0.9 - linkage cutoff for circular graph
LARGE - large style of image ( 10 pixels per data point)
RIL - population is represented by recombinant inbred lines
OUTPUT FILES:
Several image files will be generated and four text files:
ath-chrom4-map.out246.rec.matrix2d.large.png
- large image (full size image)
ath-chrom4-map.out246.rec.matrix2d.medium.png
- medium size image (1000 x 750 pixels)
ath-chrom4-map.out246.rec.matrix2d.small.png
- small image (200 x 150 pixels)
ath-chrom4-map.out246.rec.matrix2d.2000.png
- image with size 2000 x 1500 pixels (optional)
ath-chrom4-map.out246.rec.matrix2d.tab
- 2D matrix text file
ath-chrom4-map.out246.rec.recomb.large.png
- graphical genotyping of raw scores (large size)
ath-chrom4-map.out246.rec.recomb.small.png
- graphical genotyping of raw scores (small size)
ath-chrom4-map.out246.rec.recomb.xmarkers.tab
- text file with double recombinants per marker (last column)
ath-chrom4-map.out246.rec.recomb.xrils.tab
- text file with double recombinants per [inbred line]/[individual] (last column)
ath-chrom4-map.out246.rec.xgraph.large.png
- genetic map in the form of circular graph (large size)
ath-chrom4-map.out246.rec.xgraph.small.png
- genetic map in the form of circular graph (small size)
ath-chrom4-map.out246.rec.xgraph.2500.png
- genetic map in the form of circular graph 2500 pixels (optional)
ath-chrom4-map.out246.rec.xsparse.matrix
- sparse matrix for circular graph
you can check examples of output for all five Arabidopsis chromosomes
here
Visualization of Rice Genetic Map (F2 population Nipponbare x Kasalath) can be found
here
py_matrix_2D_V248_RECBIT.py
was written for CGPDB project
to assist in construction, validation and visualization of
lettuce genetic map.
Arabidopsis data were used to check program functionality and compare results with lettuce recombination data.
email to: akozik@atgc.org Alexander Kozik
last modified February 28 2005