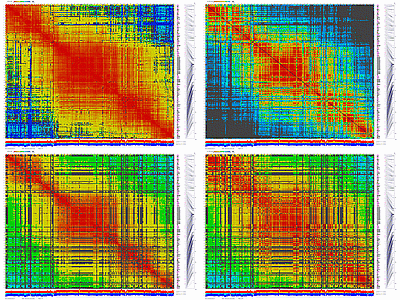
Python_MadMapper_V112_RECBIT.py Matrix and Clustering

by Alexander Kozik, UC Davis, R.Michelmore group

    OUTPUT FILES:

    ADJACENCY LISTS WITH POSITIVE LINKAGE:
  1. DL_RIL_Data.may2001.out.adj_list_01
    Adjacency list containing positive linkage information for all 1357 markers. Markers are sorted in alphabetical order. Each line is a list of markers which are linked to the first marker in the list within defined cutoff values. Cutoff values are 0.2 100 0.25 for recombination, BIT score and datapoints respectively for iteration #1.

  2. DL_RIL_Data.may2001.out.adj_list_02
    Adjacency list, iteration #2. Cutoff values are 0.18 100 0.25 for recombination, BIT score and datapoints respectively.

  3. DL_RIL_Data.may2001.out.adj_list_03
    Adjacency list, iteration #3. Cutoff values are 0.16 100 0.25 for recombination, BIT score and datapoints respectively.

  4. DL_RIL_Data.may2001.out.adj_list_04
    Adjacency list, iteration #4. Cutoff values are 0.14 100 0.25 for recombination, BIT score and datapoints respectively.

  5. DL_RIL_Data.may2001.out.adj_list_05
    Adjacency list, iteration #5. Cutoff values are 0.12 100 0.25 for recombination, BIT score and datapoints respectively.

  6. DL_RIL_Data.may2001.out.adj_list_06
    Adjacency list, iteration #6. Cutoff values are 0.10 100 0.25 for recombination, BIT score and datapoints respectively.

  7. ADJACENCY LISTS WITH NEGATIVE LINKAGE:
  8. DL_RIL_Data.may2001.out.adj_list_N1
    Adjacency list containing negative linkage information for all 1357 markers. Markers are sorted in alphabetical order. Each line is a list of markers with negative linkage to the first marker in the list within defined cutoff values. Cutoff values are 0.7 100 0.25 for recombination, BIT score and datapoints respectively for iteration #N1.

  9. DL_RIL_Data.may2001.out.adj_list_N2
    Adjacency list, iteration #2N. Cutoff values are 0.8 100 0.25 for recombination, BIT score and datapoints respectively.

  10. DL_RIL_Data.may2001.out.adj_list_N3
    Adjacency list, iteration #3N. Cutoff values are 0.9 100 0.25 for recombination, BIT score and datapoints respectively.

  11. GROUP INFO FILES (STRONG POSITIVE LINKAGE):
  12. DL_RIL_Data.may2001.out.group_info_01
    if marker "A" is linked to marker "B" and marker "B" is linked to marker "C" then marker "A" is linked to marker "C" too (transitive linkage). Grouping (clustering) is done using DFS (Depth First Search) algorithm based on analysis of corresponding adjacency lists. In this case adjacency data DL_RIL_Data.may2001.out.adj_list_01 has been used for clustering.
    • first column: marker ID
    • second column: length of adjacency list for given marker or how many other markers are linked to given marker directly
    • third column: size of the given group (how many markers in this particular group)
    • fourth column: arbitrary group number
    • fifth column: visual mark ("*****" separates different group)
    • sixth column: information about framework markers

  13. DL_RIL_Data.may2001.out.group_info_02
    Clustering of markers based on analysis of DL_RIL_Data.may2001.out.adj_list_02

  14. DL_RIL_Data.may2001.out.group_info_03
    Clustering of markers based on analysis of DL_RIL_Data.may2001.out.adj_list_03

  15. DL_RIL_Data.may2001.out.group_info_04
    Clustering of markers based on analysis of DL_RIL_Data.may2001.out.adj_list_04

  16. DL_RIL_Data.may2001.out.group_info_05
    Clustering of markers based on analysis of DL_RIL_Data.may2001.out.adj_list_05

  17. DL_RIL_Data.may2001.out.group_info_06
    Clustering of markers based on analysis of DL_RIL_Data.may2001.out.adj_list_06
    Note that number of groups (clusters) is increased in each iteration.

  18. GROUP INFO FILES (STRONG NEGATIVE LINKAGE):
  19. DL_RIL_Data.may2001.out.group_info_N1
    Results of group analysis (clustering) for markers with negative linkage, iteration #N1

  20. DL_RIL_Data.may2001.out.group_info_N2
    Results of group analysis (clustering) for markers with negative linkage, iteration #N2

  21. DL_RIL_Data.may2001.out.group_info_N3
    Results of group analysis (clustering) for markers with negative linkage, iteration #N3

  22. GROUP INFO FILE (SUMMARY FOR STRONG POSITIVE LINKAGE):
  23. DL_RIL_Data.may2001.out.group_info_Summary
    Concatenated files for six iterations of positive clustering.

  24. MATRIX FILES (STRONG POSITIVE LINKAGE):
  25. DL_RIL_Data.may2001.out.matrix_01
    Pairwise data (matrix) for positive clustering (recombination 0.20 or less), iteration #1
    • first column: marker ID "A"
    • second column: marker ID "B"
    • third column: recombination value between markers "A" and "B"
    • fourth column: BIT score for markers "A" and "B"
    • fifth column: datapoints value (fraction of datapoints for pair "A" and "B")
    Adjacency list DL_RIL_Data.may2001.out.adj_list_01 was derived by analysis of this matrix file

  26. DL_RIL_Data.may2001.out.matrix_02
    Pairwise data (matrix) for positive clustering (recombination 0.18 or less), iteration #2

  27. DL_RIL_Data.may2001.out.matrix_03
    Pairwise data (matrix) for positive clustering (recombination 0.16 or less), iteration #3

  28. DL_RIL_Data.may2001.out.matrix_04
    Pairwise data (matrix) for positive clustering (recombination 0.14 or less), iteration #4

  29. DL_RIL_Data.may2001.out.matrix_05
    Pairwise data (matrix) for positive clustering (recombination 0.12 or less), iteration #5

  30. DL_RIL_Data.may2001.out.matrix_06
    Pairwise data (matrix) for positive clustering (recombination 0.10 or less), iteration #6

  31. MATRIX FILES (STRONG NEGATIVE LINKAGE):
  32. DL_RIL_Data.may2001.out.matrix_N1
    Pairwise data (matrix) for negative clustering (recombination 0.7 or better), iteration #N1

  33. DL_RIL_Data.may2001.out.matrix_N2
    Pairwise data (matrix) for negative clustering (recombination 0.8 or better), iteration #N2

  34. DL_RIL_Data.may2001.out.matrix_N3
    Pairwise data (matrix) for negative clustering (recombination 0.9 or better), iteration #N3

  35. SUMMARY MATRIX FILES:
  36. DL_RIL_Data.may2001.out.pairs_all
    This file is large (~ 50 Mb). It contains pairwise data for all markers if fraction of datapoints is 0.25 or better. It contains recombination values for pairs of markers with positive as well as with negative linkage. Usually this file is used as input file ("global" matrix) to generate genetic map 2D plots (checkmatrix)
    • first column: marker ID "A"
    • second column: marker ID "B"
    • third column: recombination value between markers "A" and "B"
    • fourth column: BIT score for pair "A" and "B"
    • fifth column: datapoints value (fraction of datapoints for pair "A" and "B")
    • sixth column: "***" - visual mark
    • seventh column: total number of recombination events
    • eighth column: total number of datapoints
    • ninth column: total number of data loss
    • tenth column: total number of possible comparisons (number of RILs)

  37. DL_RIL_Data.may2001.out.pairs_negative
    Pairwise data for markers with negative linkage (recombination 0.6 or better) [size of file ~ 3 Mb]

  38. DL_RIL_Data.may2001.out.pairs_positive
    Pairwise data for markers with positive linkage (recombination 0.4 or less) [size of file ~ 10 Mb]

  39. ADDITIONAL INFO FILES:
  40. DL_RIL_Data.may2001.out.set_dupl
    if file with marker scores contains duplicated IDs then those duplicated IDs with scores are written into this file: DL_RIL_Data.may2001.out.set_dupl

  41. DL_RIL_Data.may2001.out.set_uniq
    non-redundant set of markers with recombination scores
    [if no duplications were found it should be identical to original *.loc file]

  42. DL_RIL_Data.may2001.out.x_log_file
    log file

  43. DL_RIL_Data.may2001.out.x_scores_stat
    summary for recombination scores
    • 1-st column (MARKER_ID): marker ID
    • 2-nd column (00_01): number of markers linked to a given marker within 0.0 - 0.1 recombination frequency (strong positive linkage)
    • 3-d column (01_02): number of markers linked to a given marker within 0.1 - 0.2 recombination frequency (strong positive linkage)
    • 4-th column (02_03): number of markers linked to a given marker within 0.2 - 0.3 recombination frequency (positive linkage)
    • 5-th column (03_04): number of markers linked to a given marker within 0.3 - 0.4 recombination frequency
    • 6-th column (04_05): number of markers linked to a given marker within 0.4 - 0.5 recombination frequency
    • 7-th column (05_06): number of markers linked to a given marker within 0.5 - 0.6 recombination frequency
    • 8-th column (06_07): number of markers linked to a given marker within 0.6 - 0.7 recombination frequency
    • 9-th column (07_08): number of markers linked to a given marker within 0.7 - 0.8 recombination frequency (negative linkage)
    • 10-th column (08_09): number of markers linked to a given marker within 0.8 - 0.9 recombination frequency (strong negative linkage)
    • 11-th column (09_10): number of markers linked to a given marker within 0.9 - 1.0 recombination frequency (strong negative linkage)
    • 12-th column (REC:P-N): difference between strong positive and strong negative events [ (00_01+01_02) minus (08_09+09_10) ]
    • 13-th column (REC_ABS): absolute recombination value for a given marker (accumulative value for all possible recombination values) [ Summary of all (0.5 - recombination frequency) ]
    • 14-th column (***): "***" - visual mark
    • 15-th column (BIT_POS): number of markers having BIT score 100 or higher to a given marker (positive BIT scores)
    • 16-th column (BIT_MED): number of markers having BIT score within 100 and -100 range (low or medium BIT scores)
    • 17-th column (BIT_NEG): number of markers having BIT score -100 or lower to a given marker (negative BIT scores)
    • 18-th column (BIT:P-N): difference between positive and negative BIT scores [ BIT_POS minus BIT_NEG ]
    • 19-th column (BIT_ABS): absolute BIT value (score) for a given marker (accumulative value for all possible BIT scores) [ Summary of all BIT scores ]
    • 20-th column (***): "***" - visual mark
    • 21-st column (SUMMARY): brief summary about positive/negative dominance

    • Note, this table is useful for:
      A - to identify sets of markers with noticeable negative linkage to some loci.
      B - to identify sets of markers having positive linkage only.
      C - to identify sets of markers which probably were mis-scored (For example, take a look on kelp marker. It has strong negative scores only. It seems that all "A"-s were replaced by "B"-s what was a reason of negative scores only).


DEEP CLUSTERING AND GROUPING


NEW VERSIONS, UNDER DEVELOPMENT, PROVIDED AS IS

Python_MadMapper_V248_RECBIT_012.py checks all possible combinations of "triplets" of markers for double crossovers and generates output with "best marker pairs/triplets". It works in cubic time, NxNxN, where N is a number of markers. Script generates a list with possibly noisy (bad) markers.
Read more about this 248 version README_MADMAPPER_248
Example test locus file: madmapper_scores.loc


Python_MadCluster_V224_GENERAL.py is designed to work with "general" binary data to cluster nodes. It uses "00", "01", "10" and "11" values to create distance matrix and following clustering.


Python_MadMapper_V112_RECBIT.py was written for CGPDB project to assist in construction, validation and visualization of lettuce genetic map. Arabidopsis data were used to check program functionality and compare results with lettuce recombination data.

email to: akozik@atgc.org Alexander Kozik

last modified August 29 2005