|
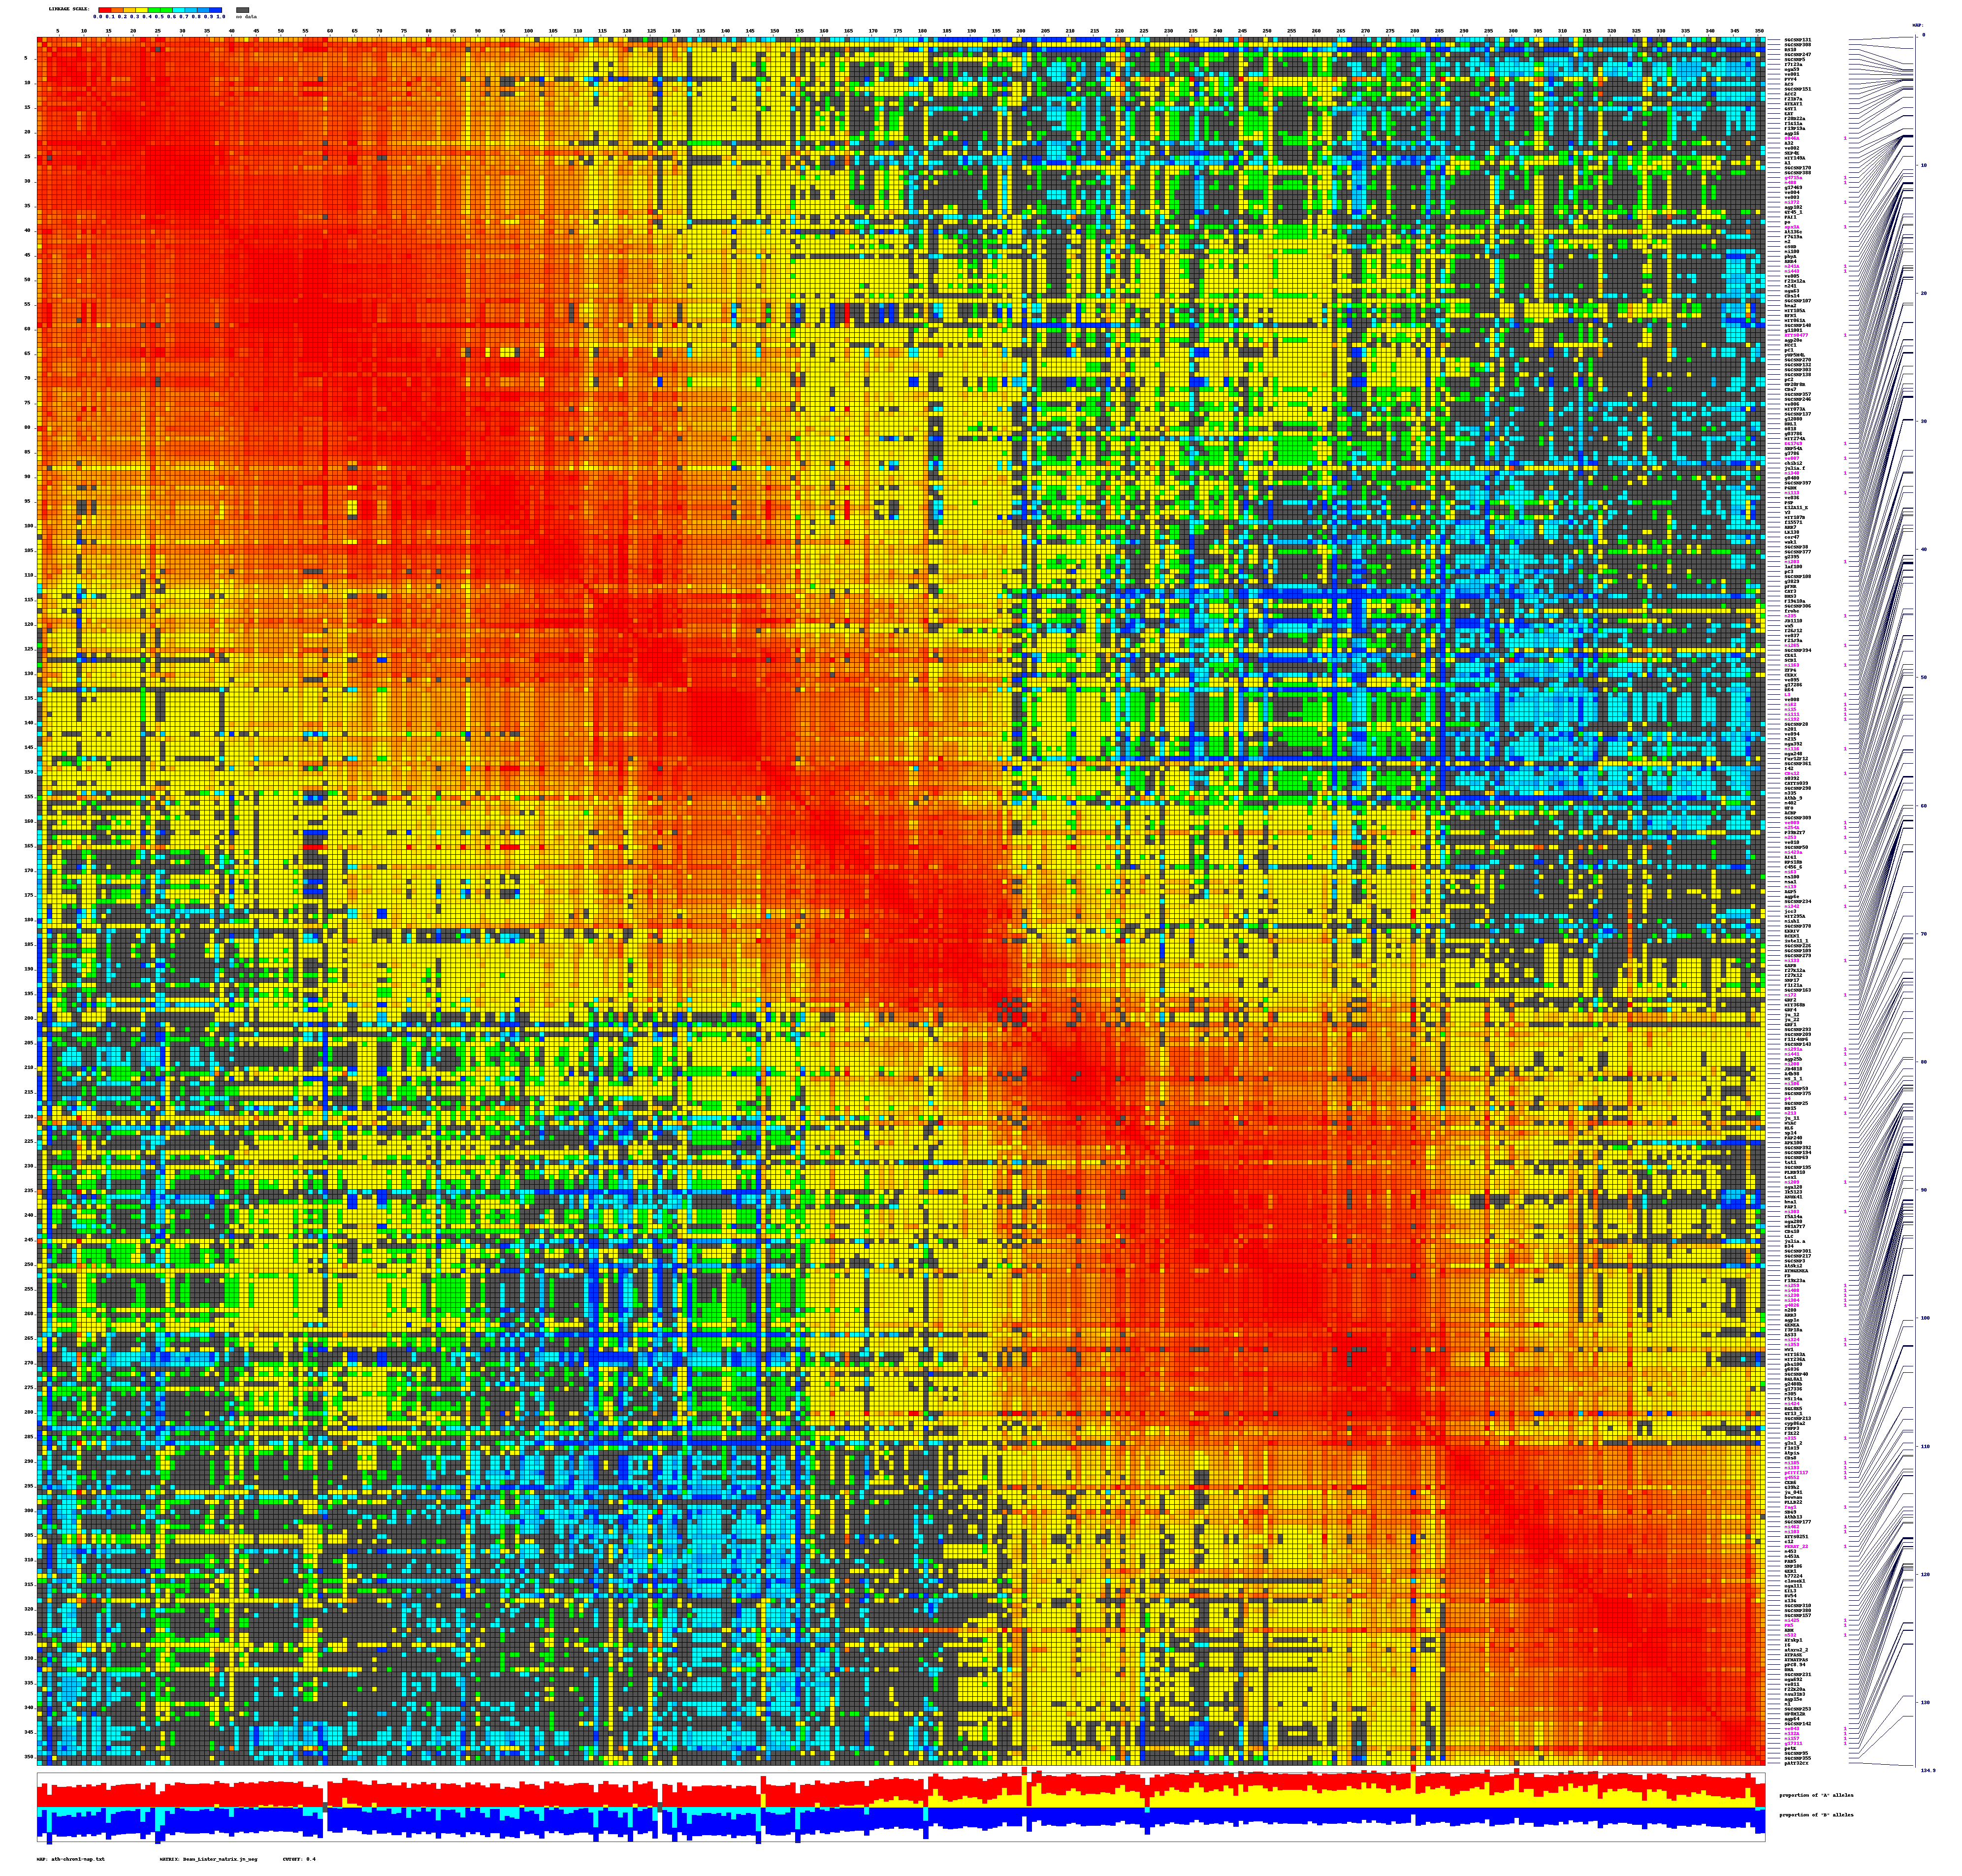
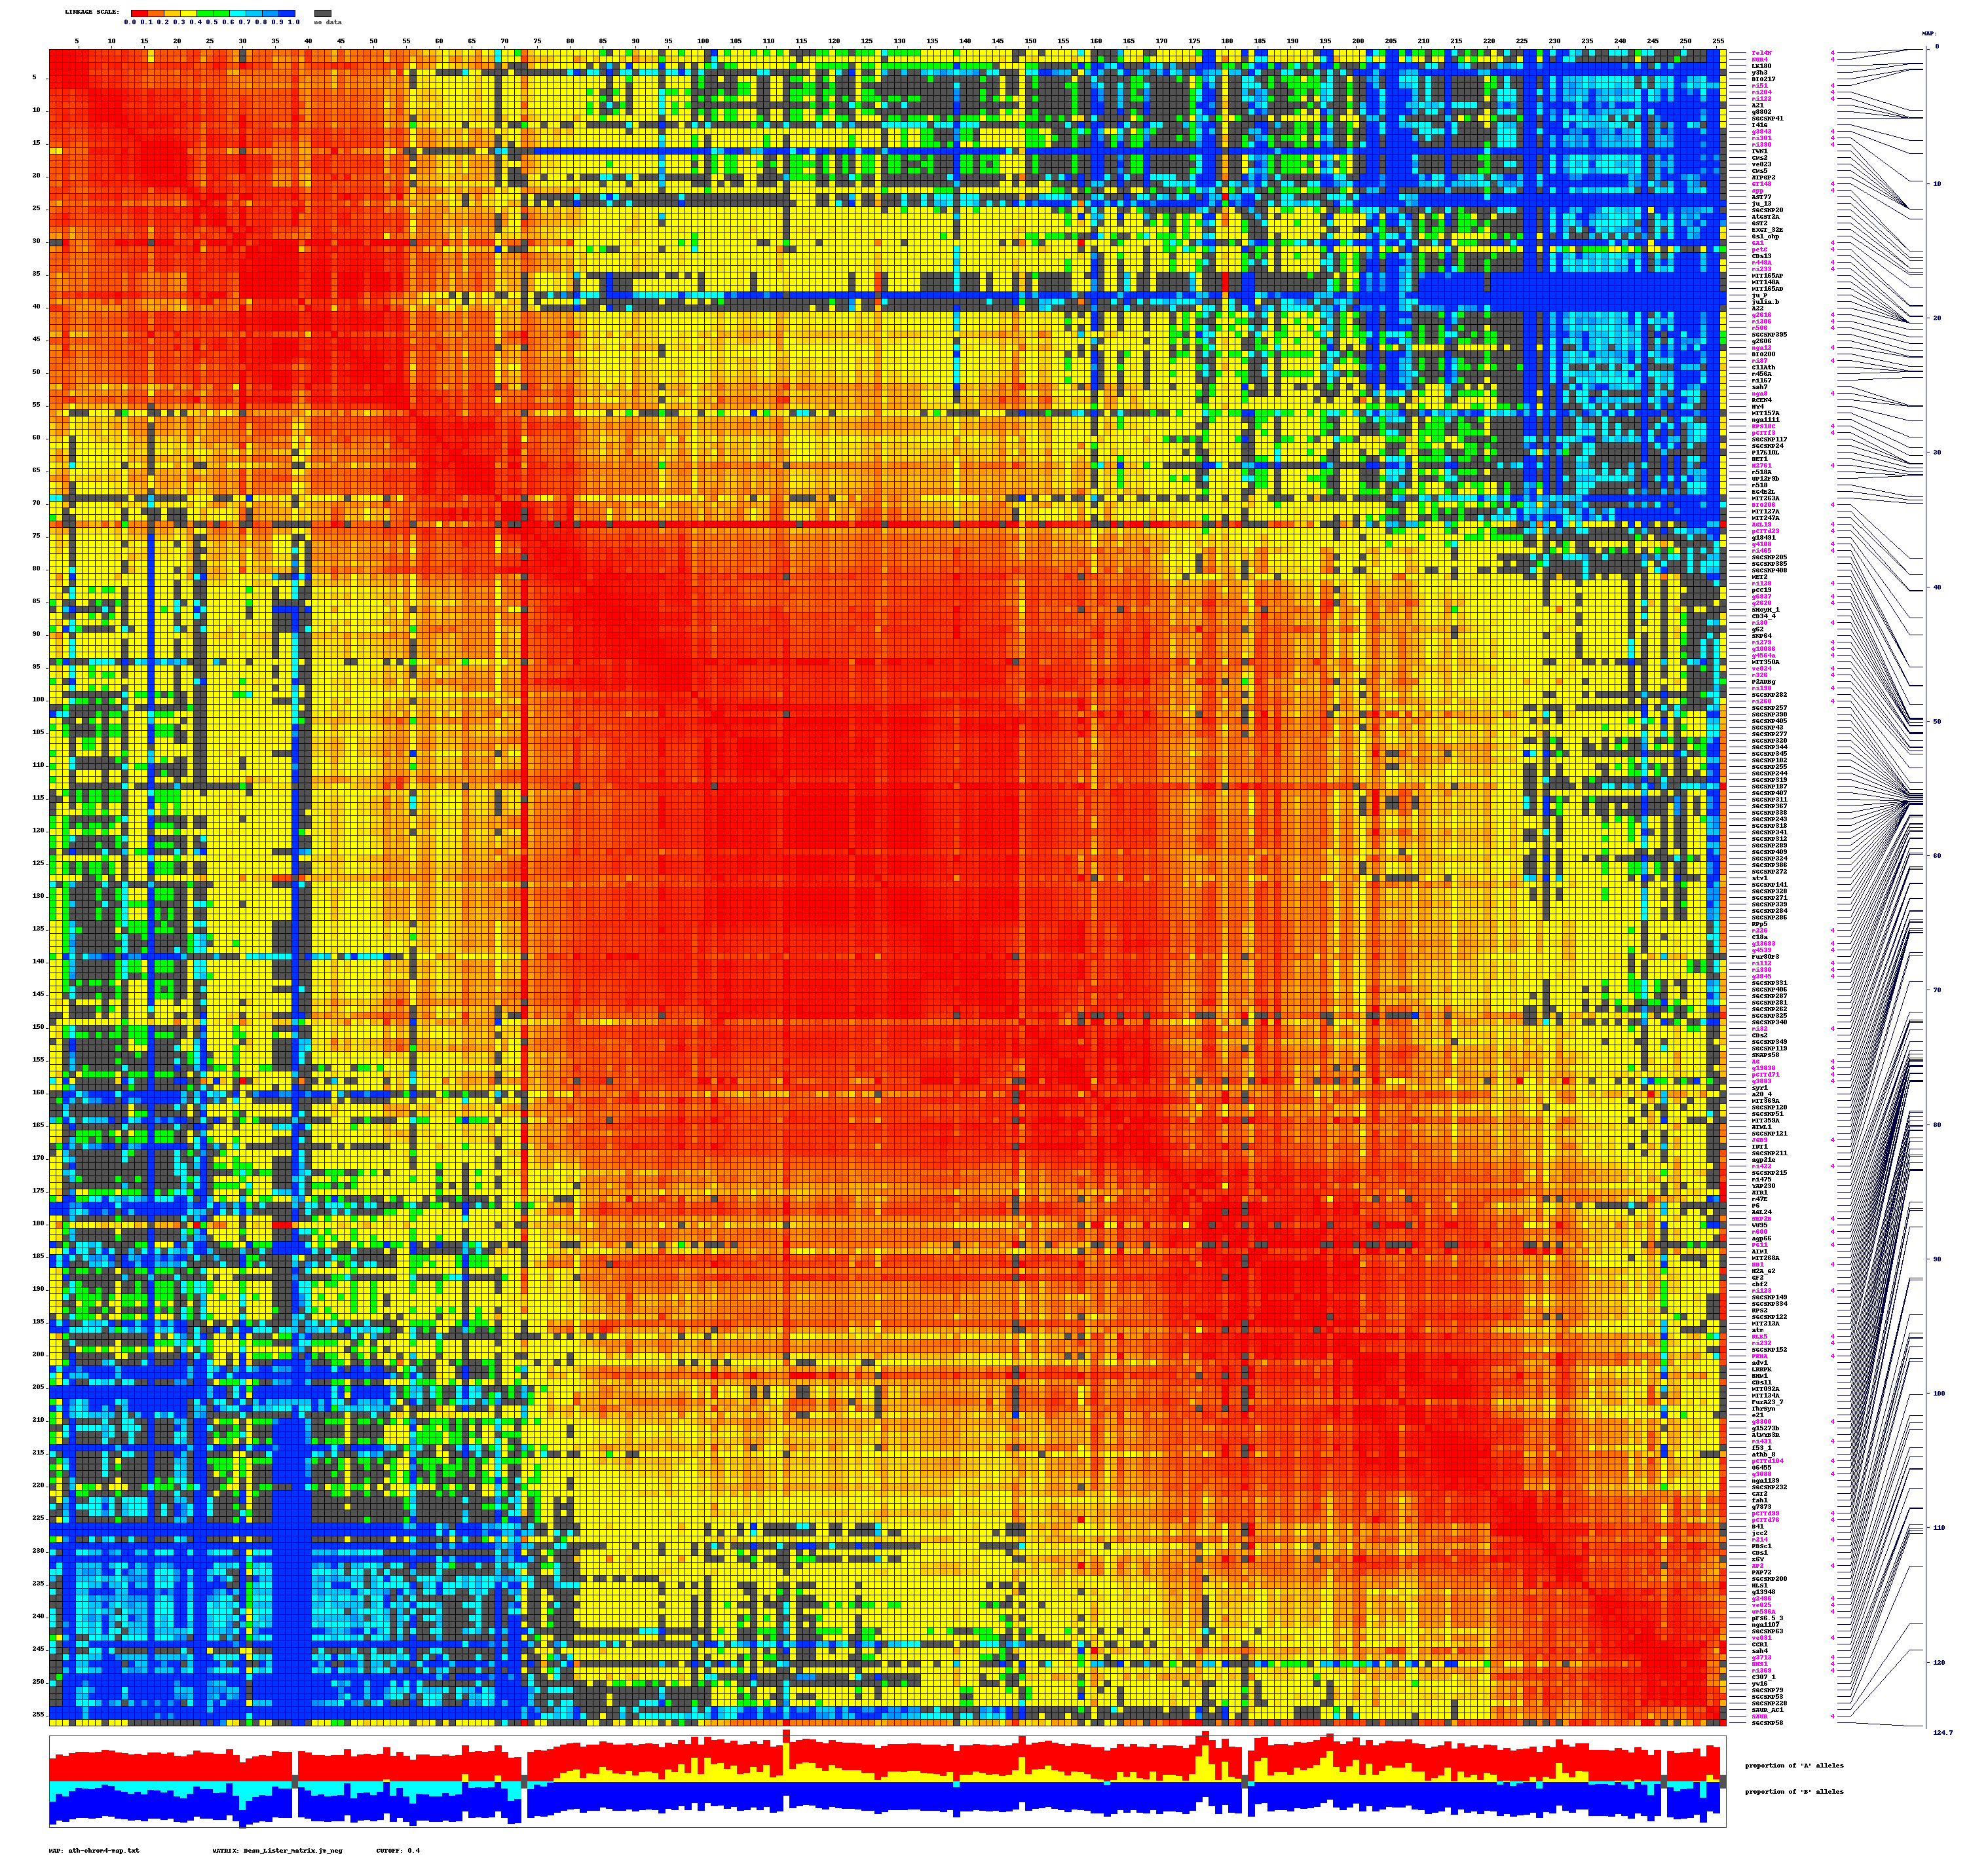
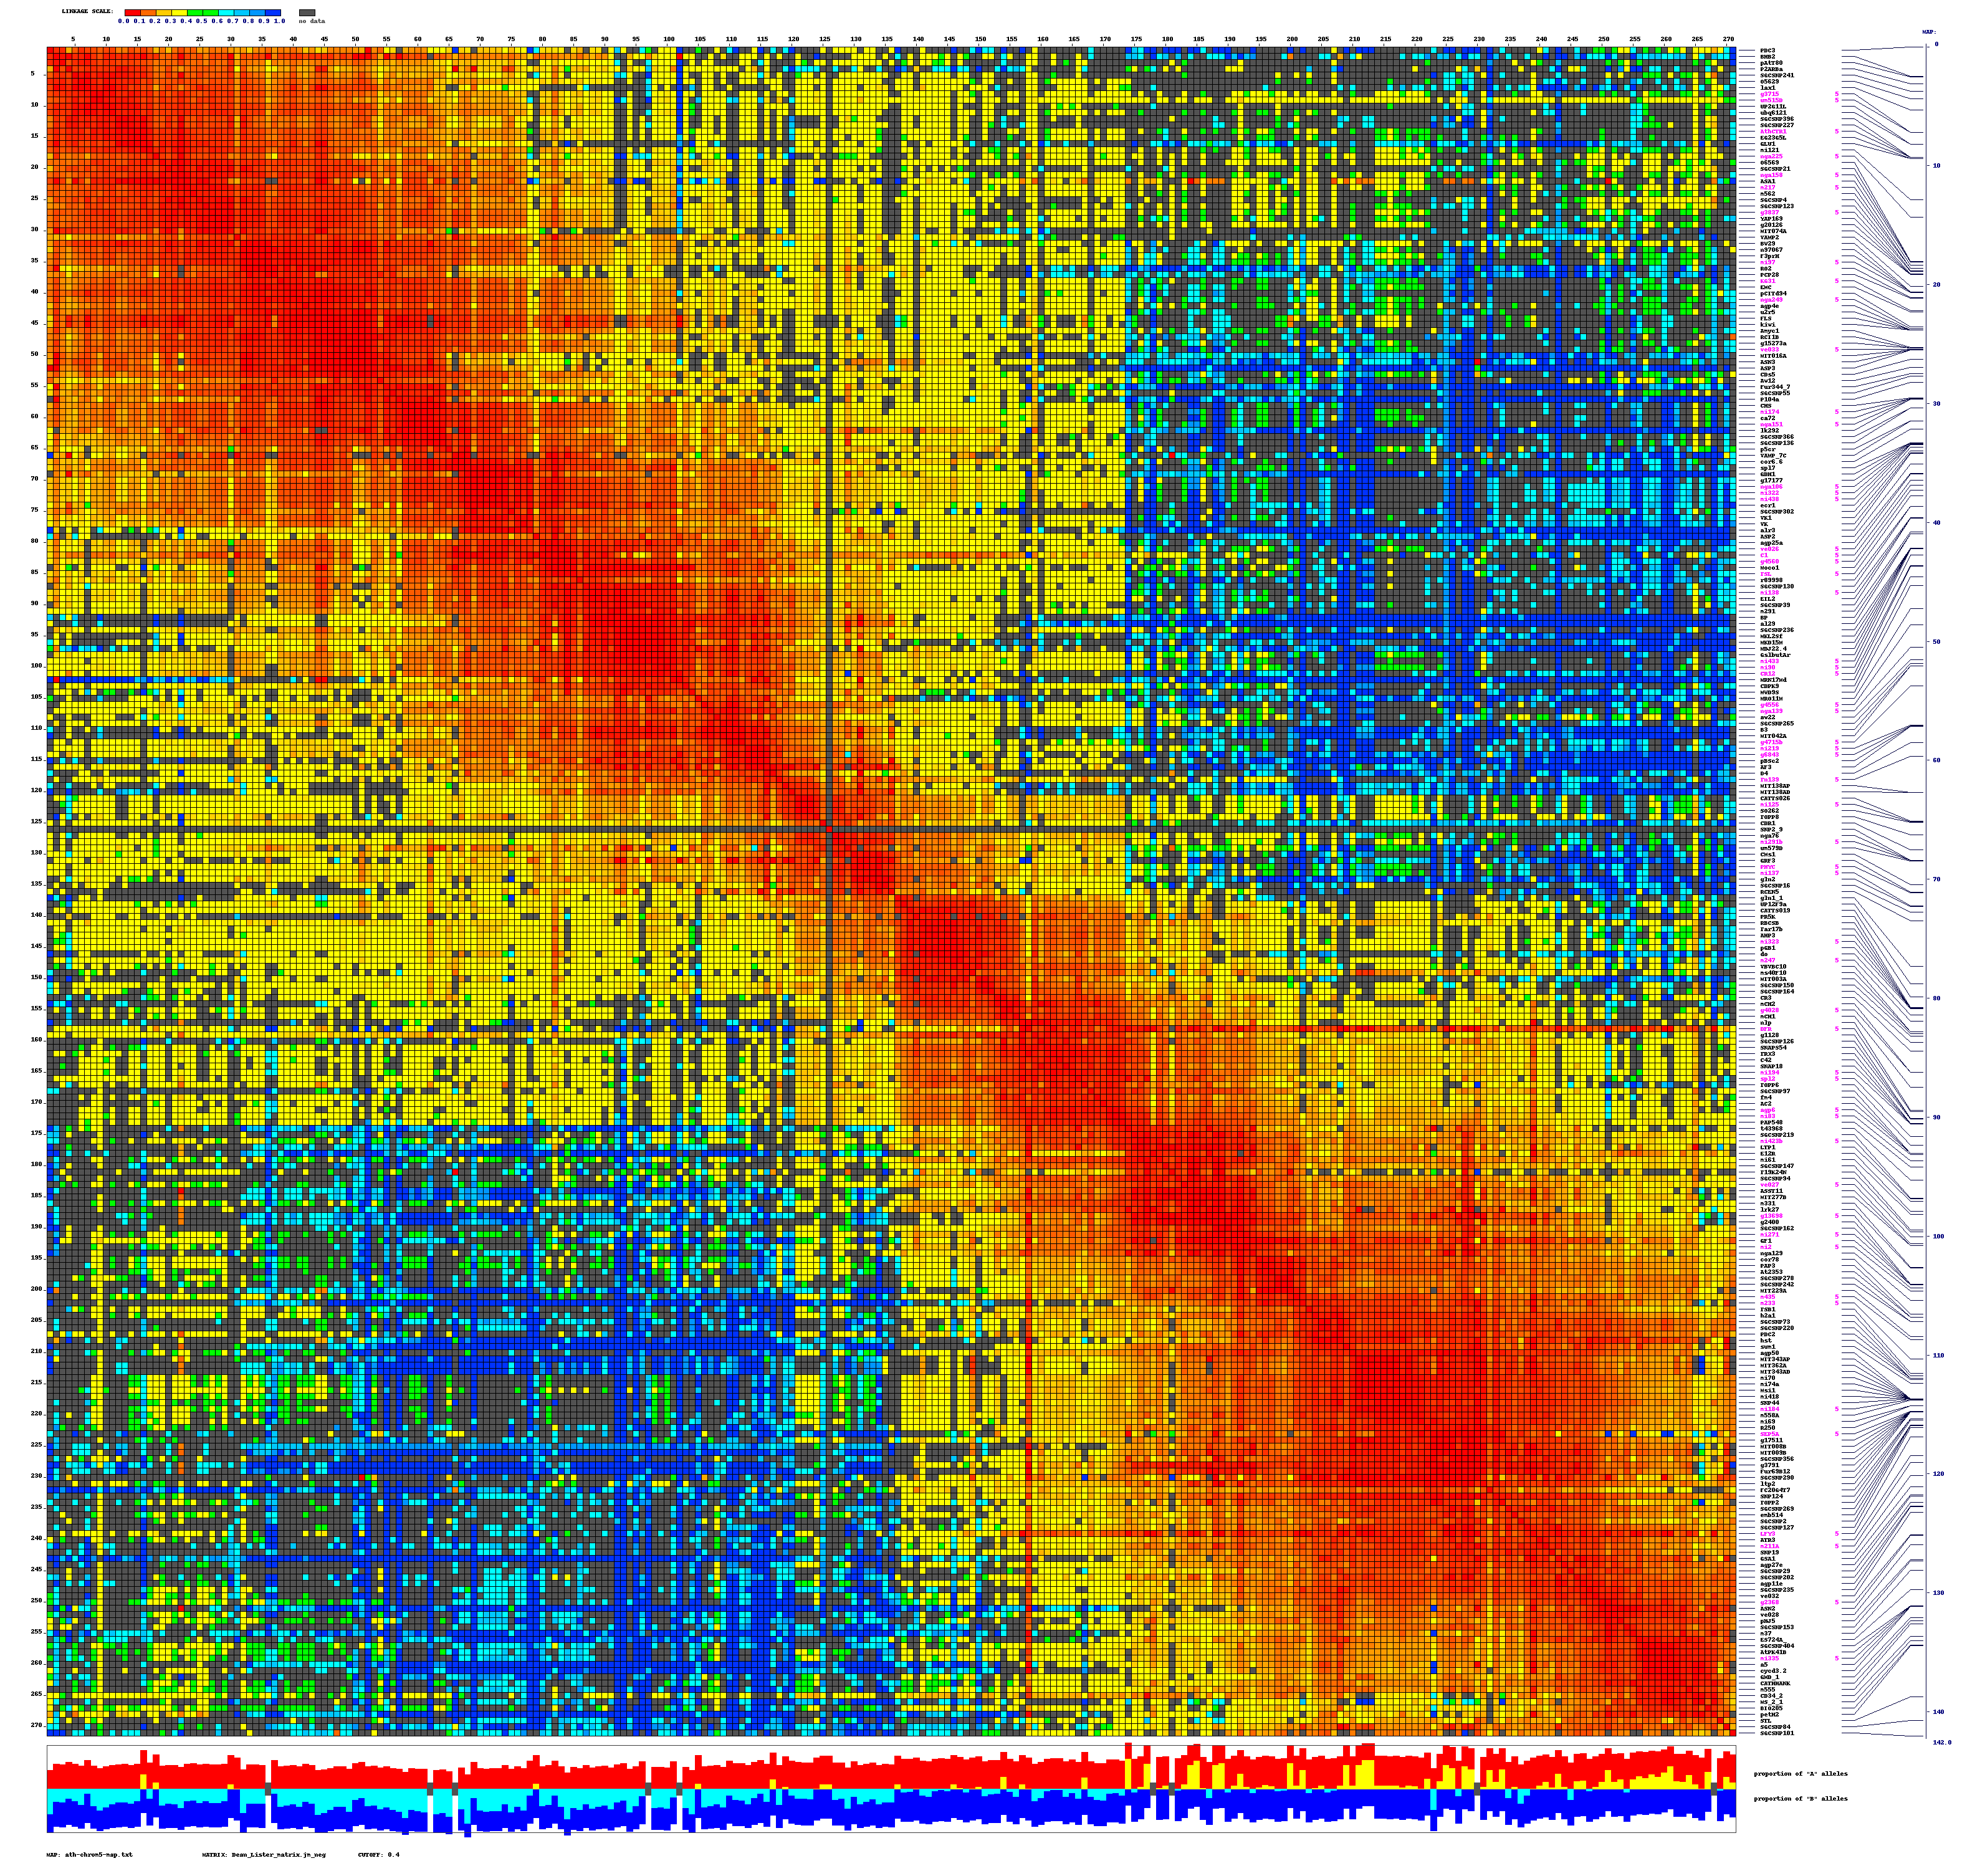
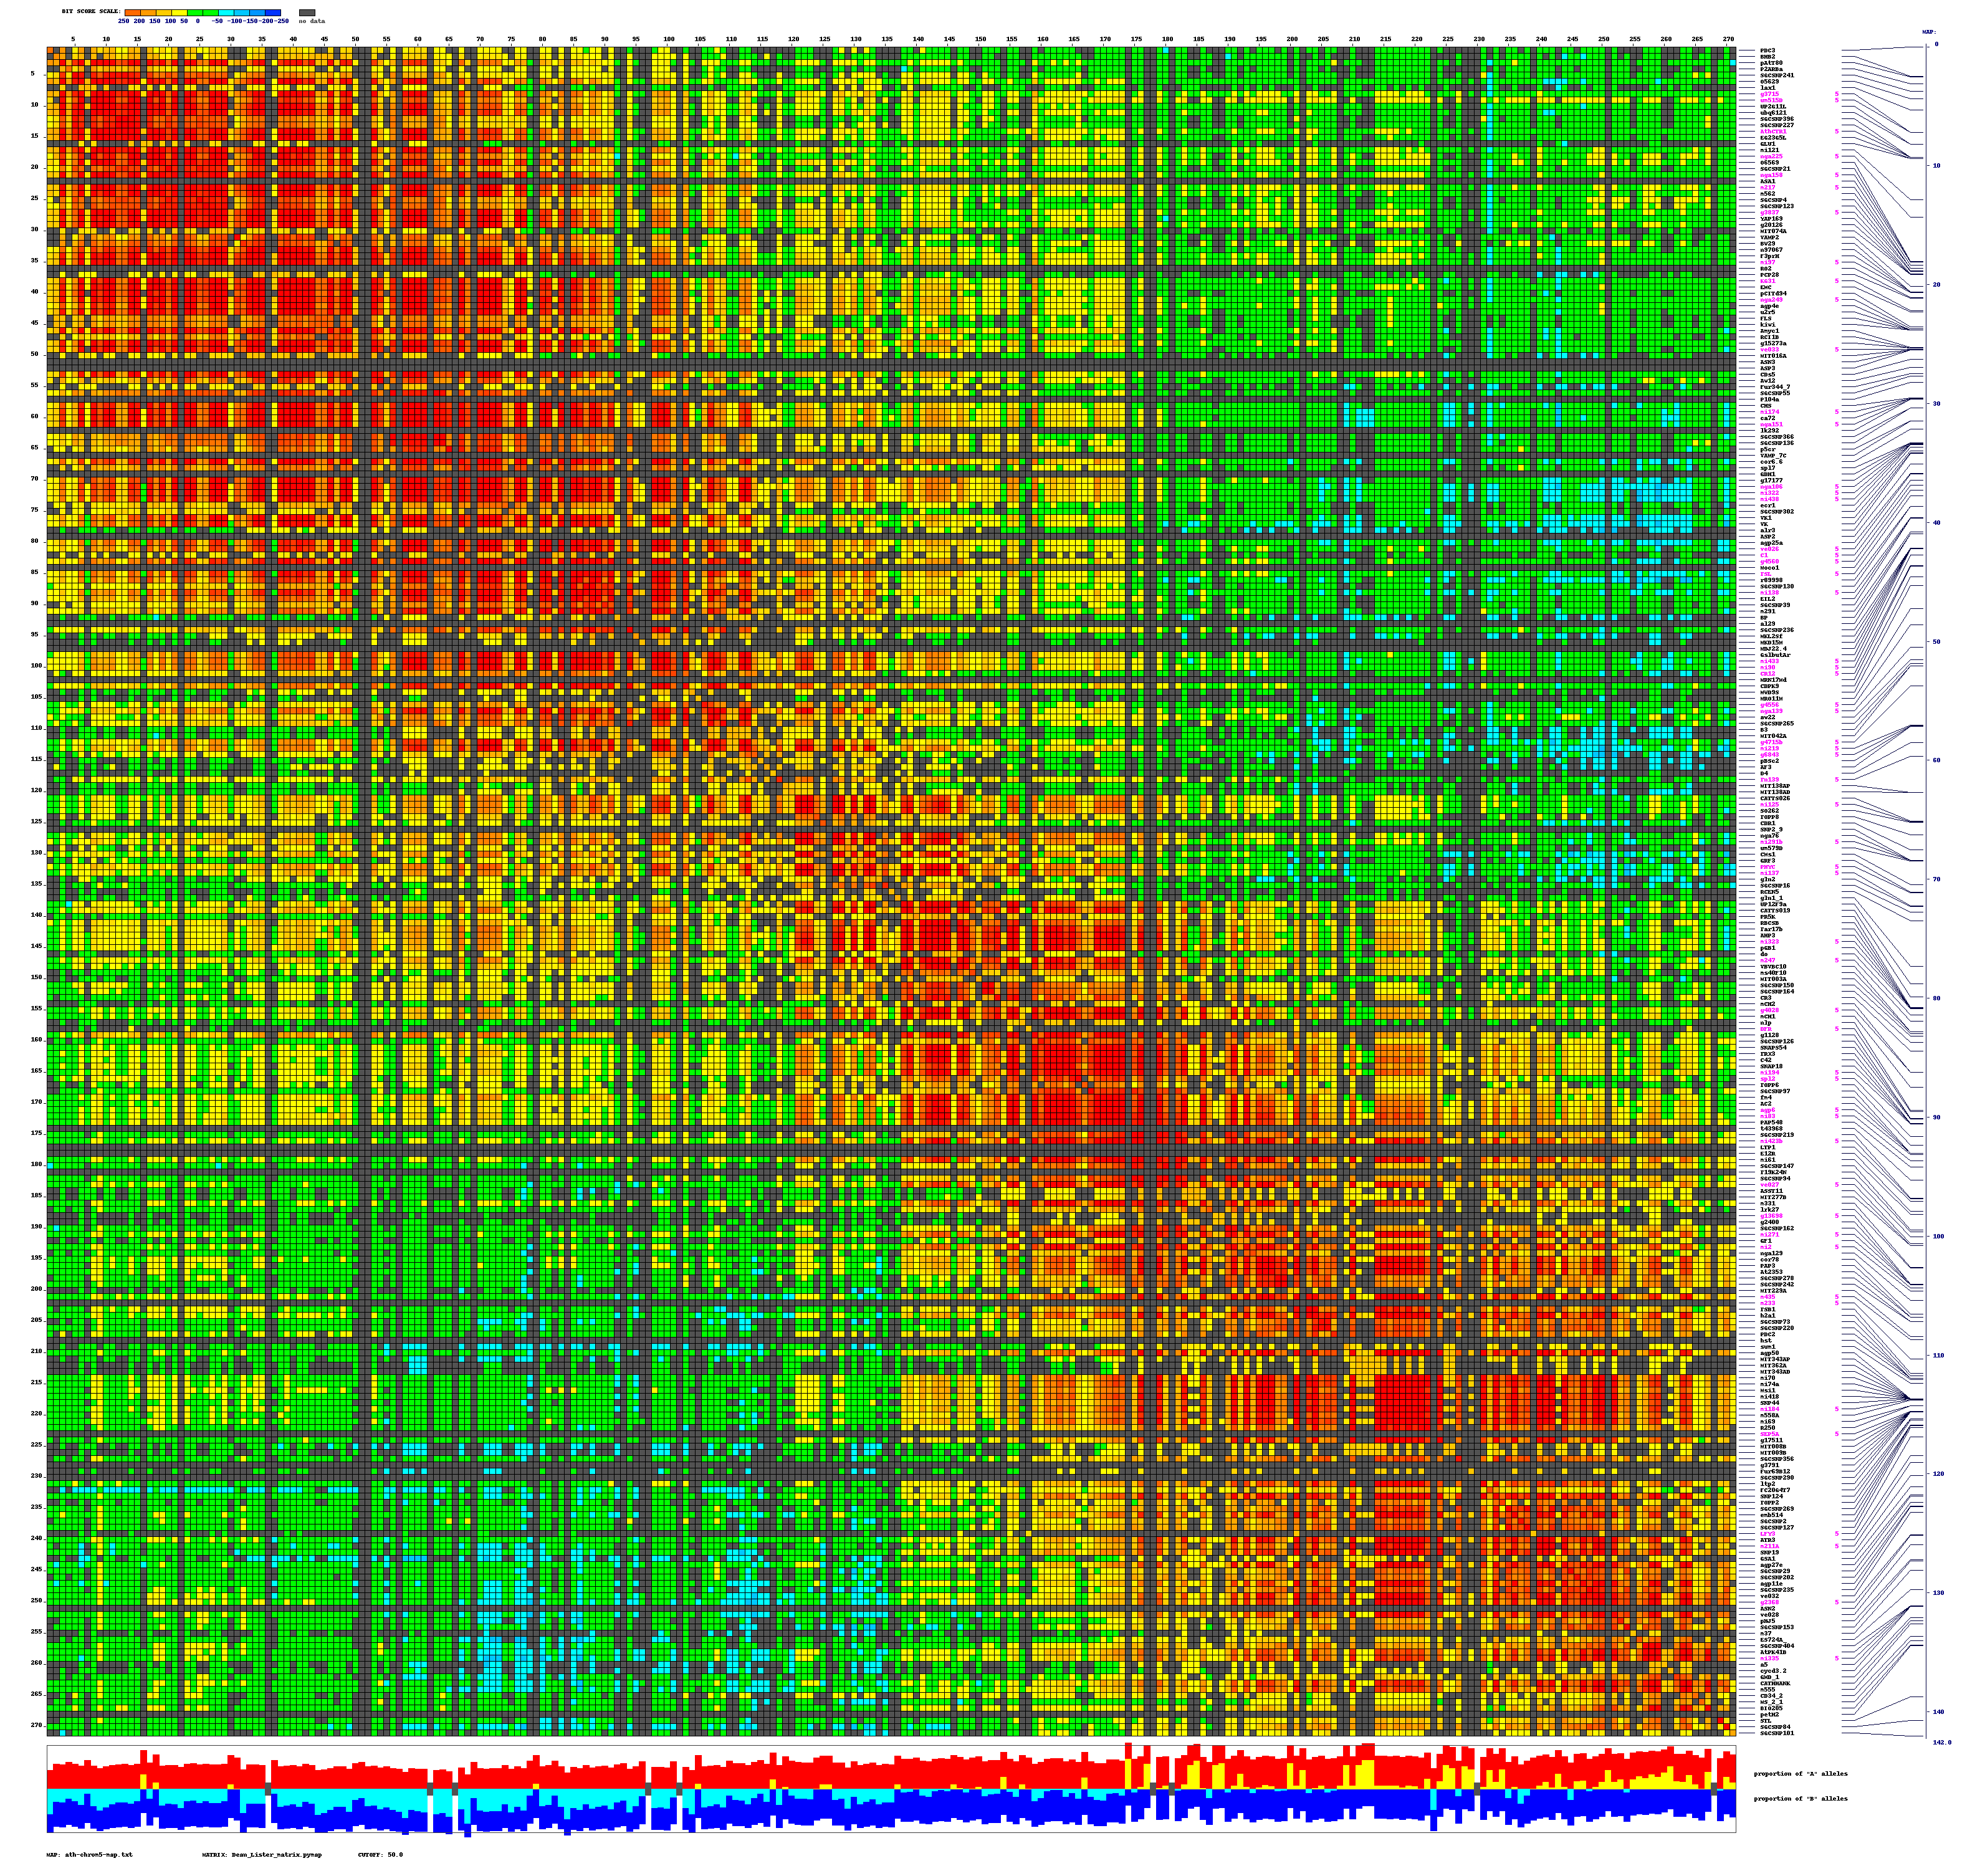
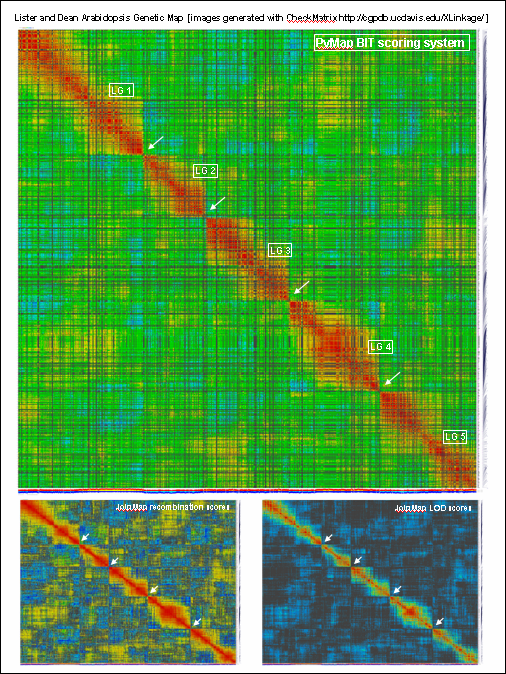
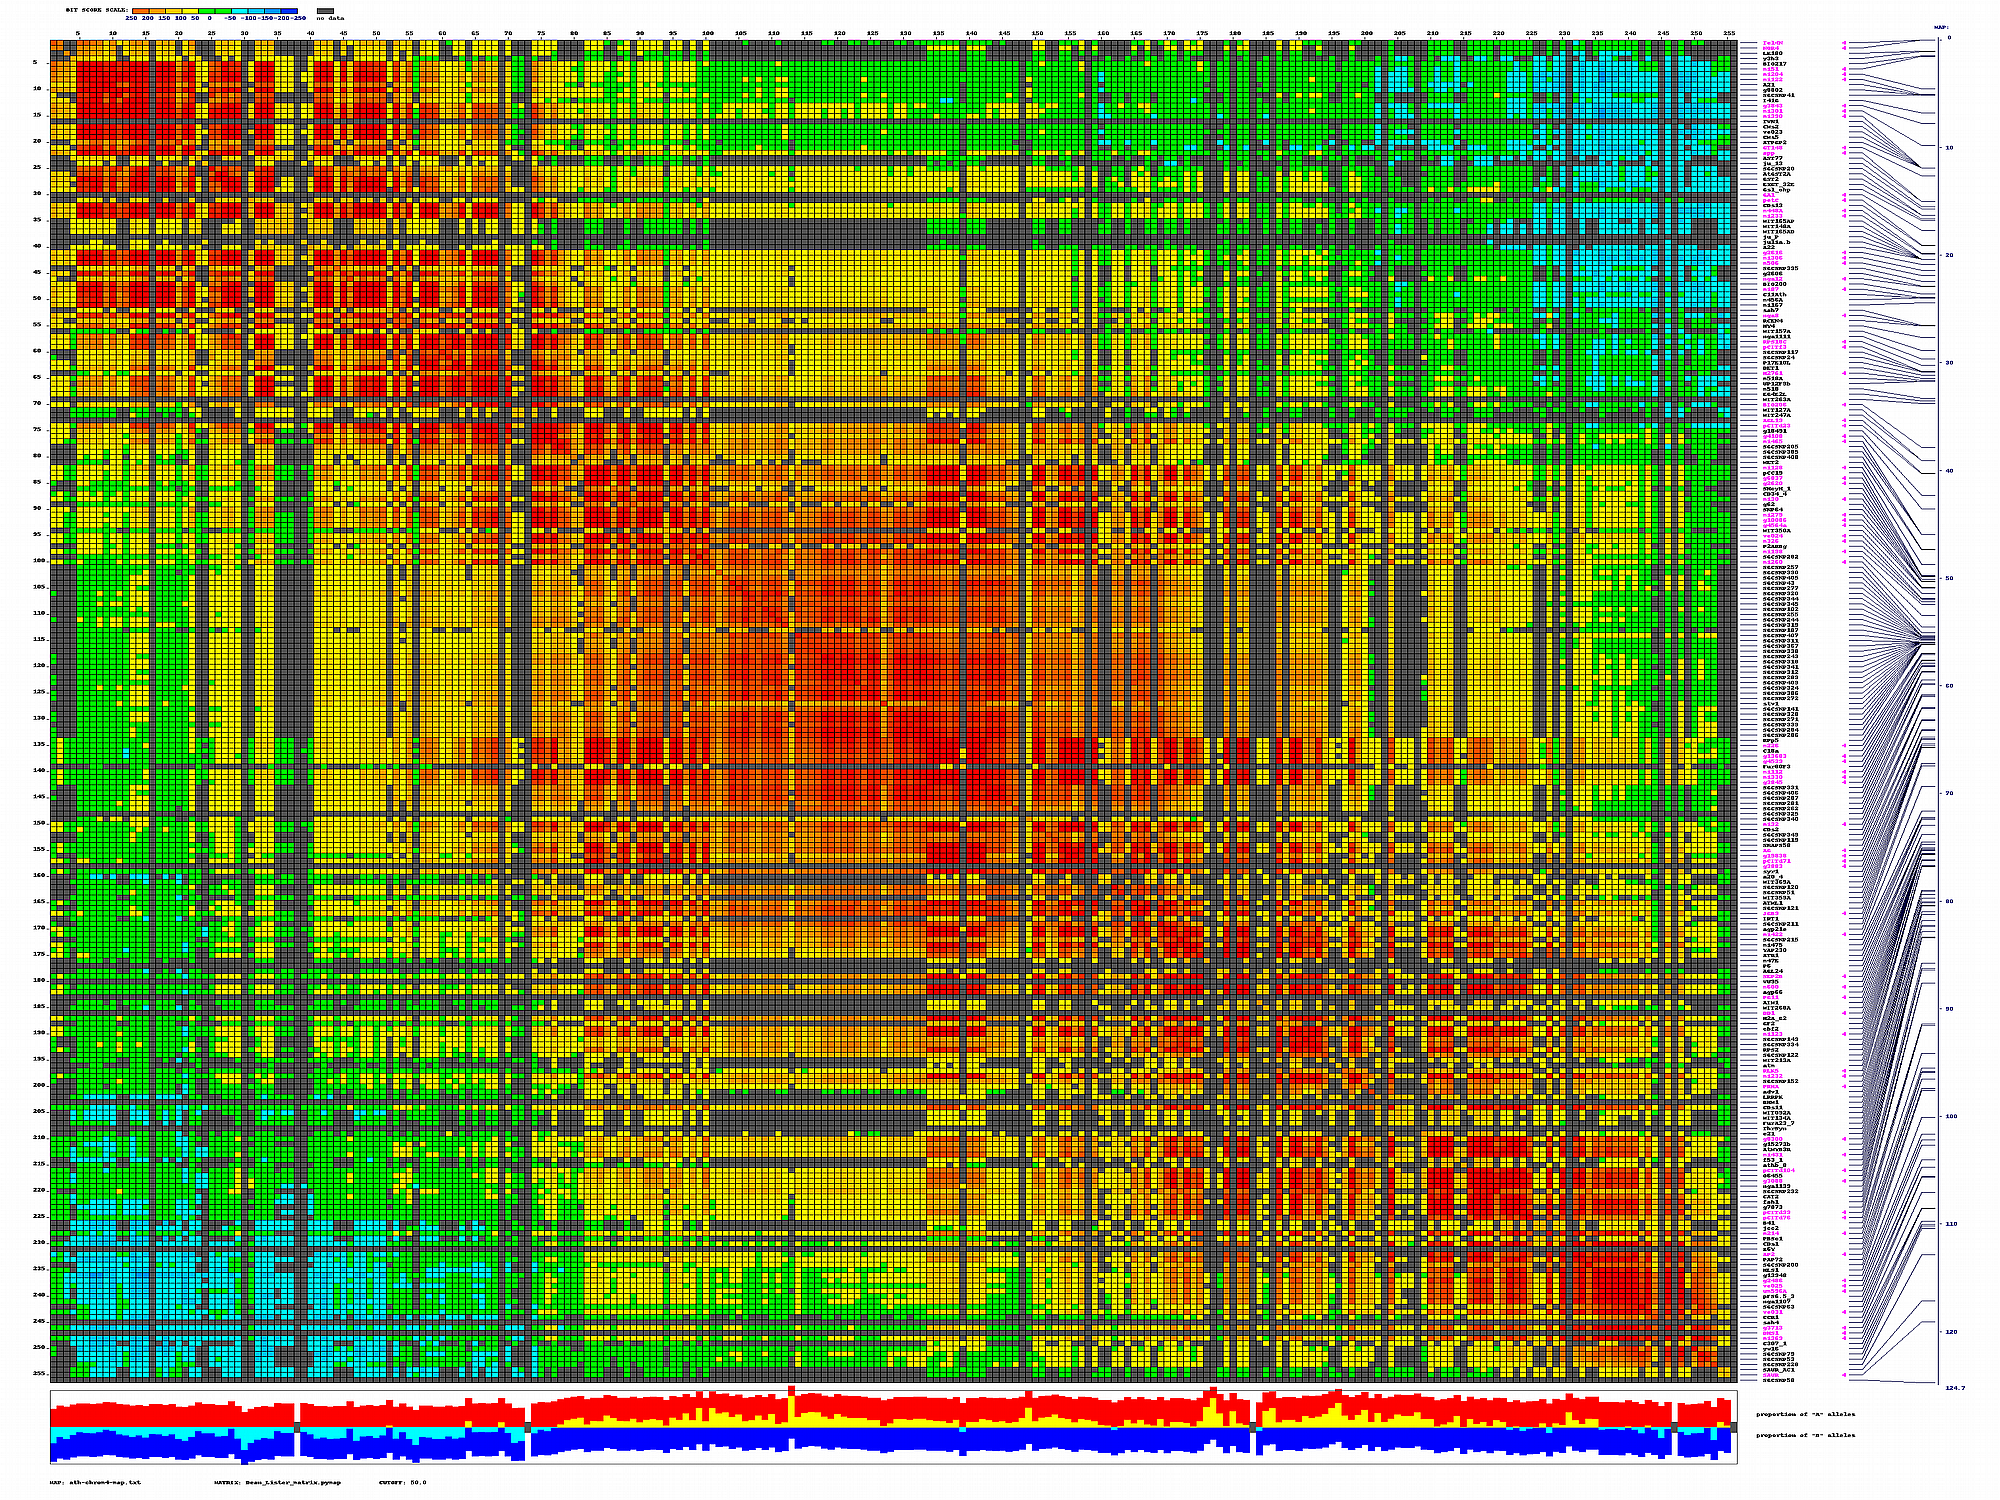
py_matrix_2D_V087_RECBIT.py
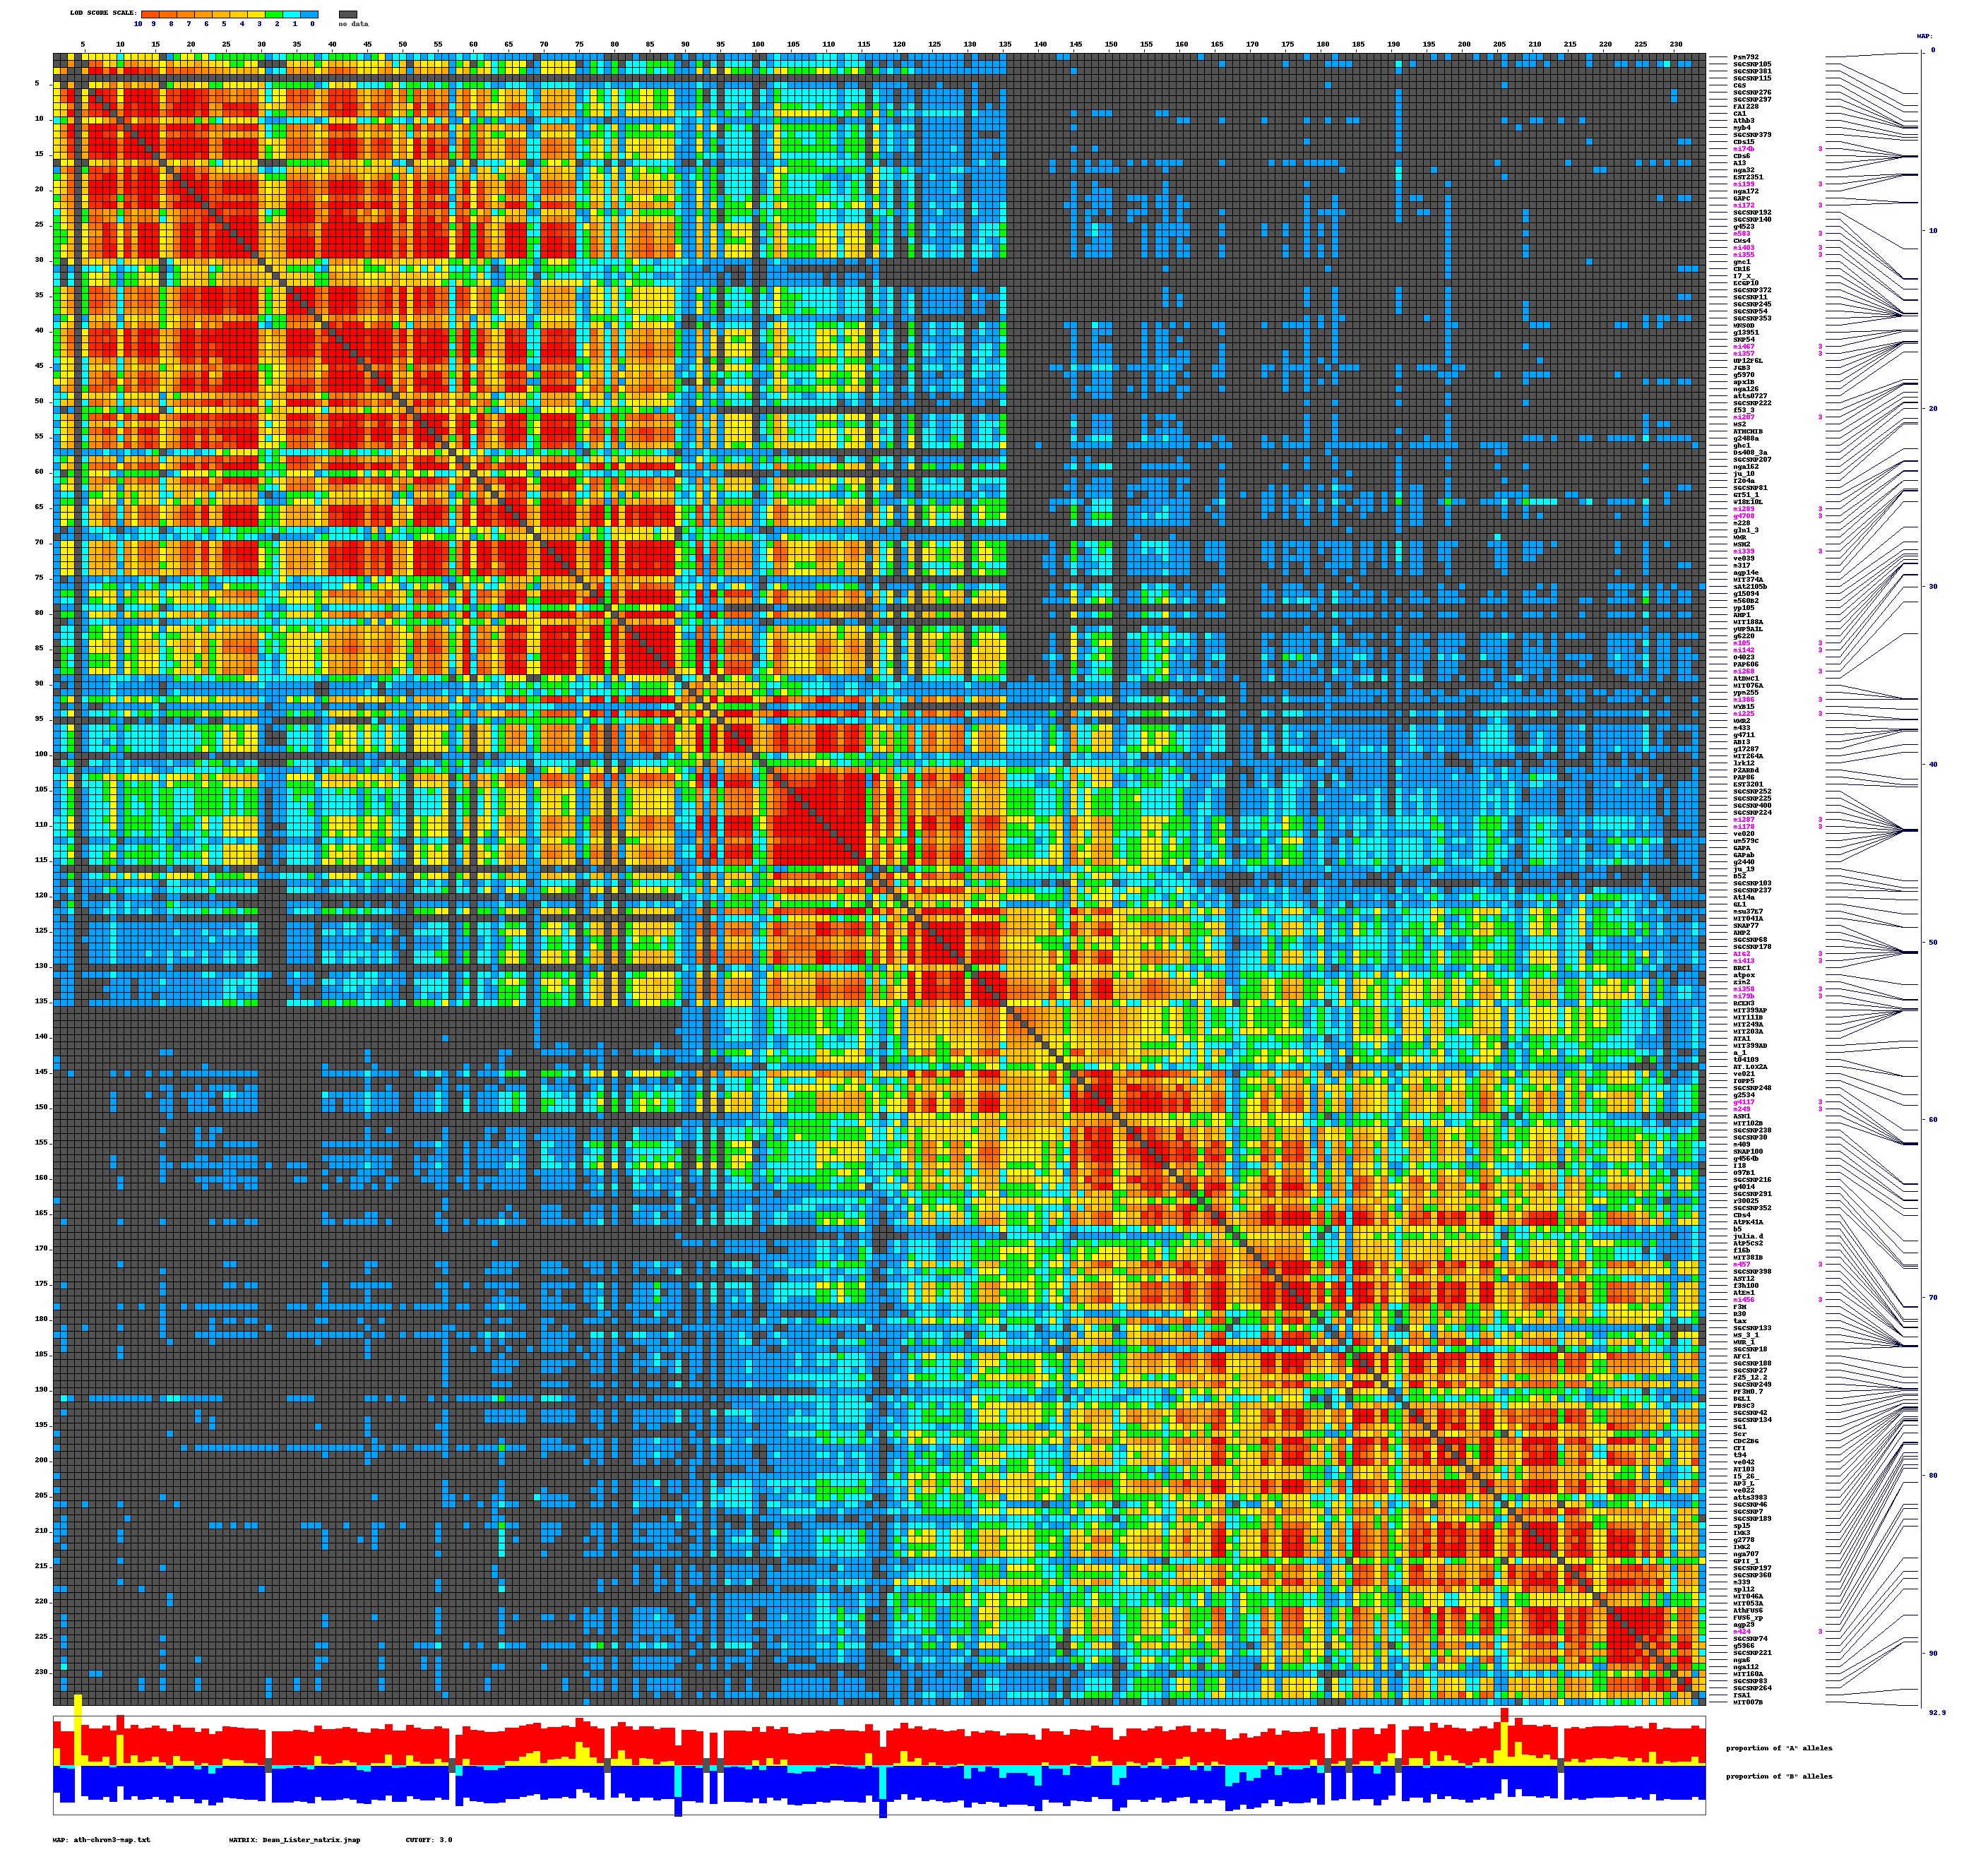
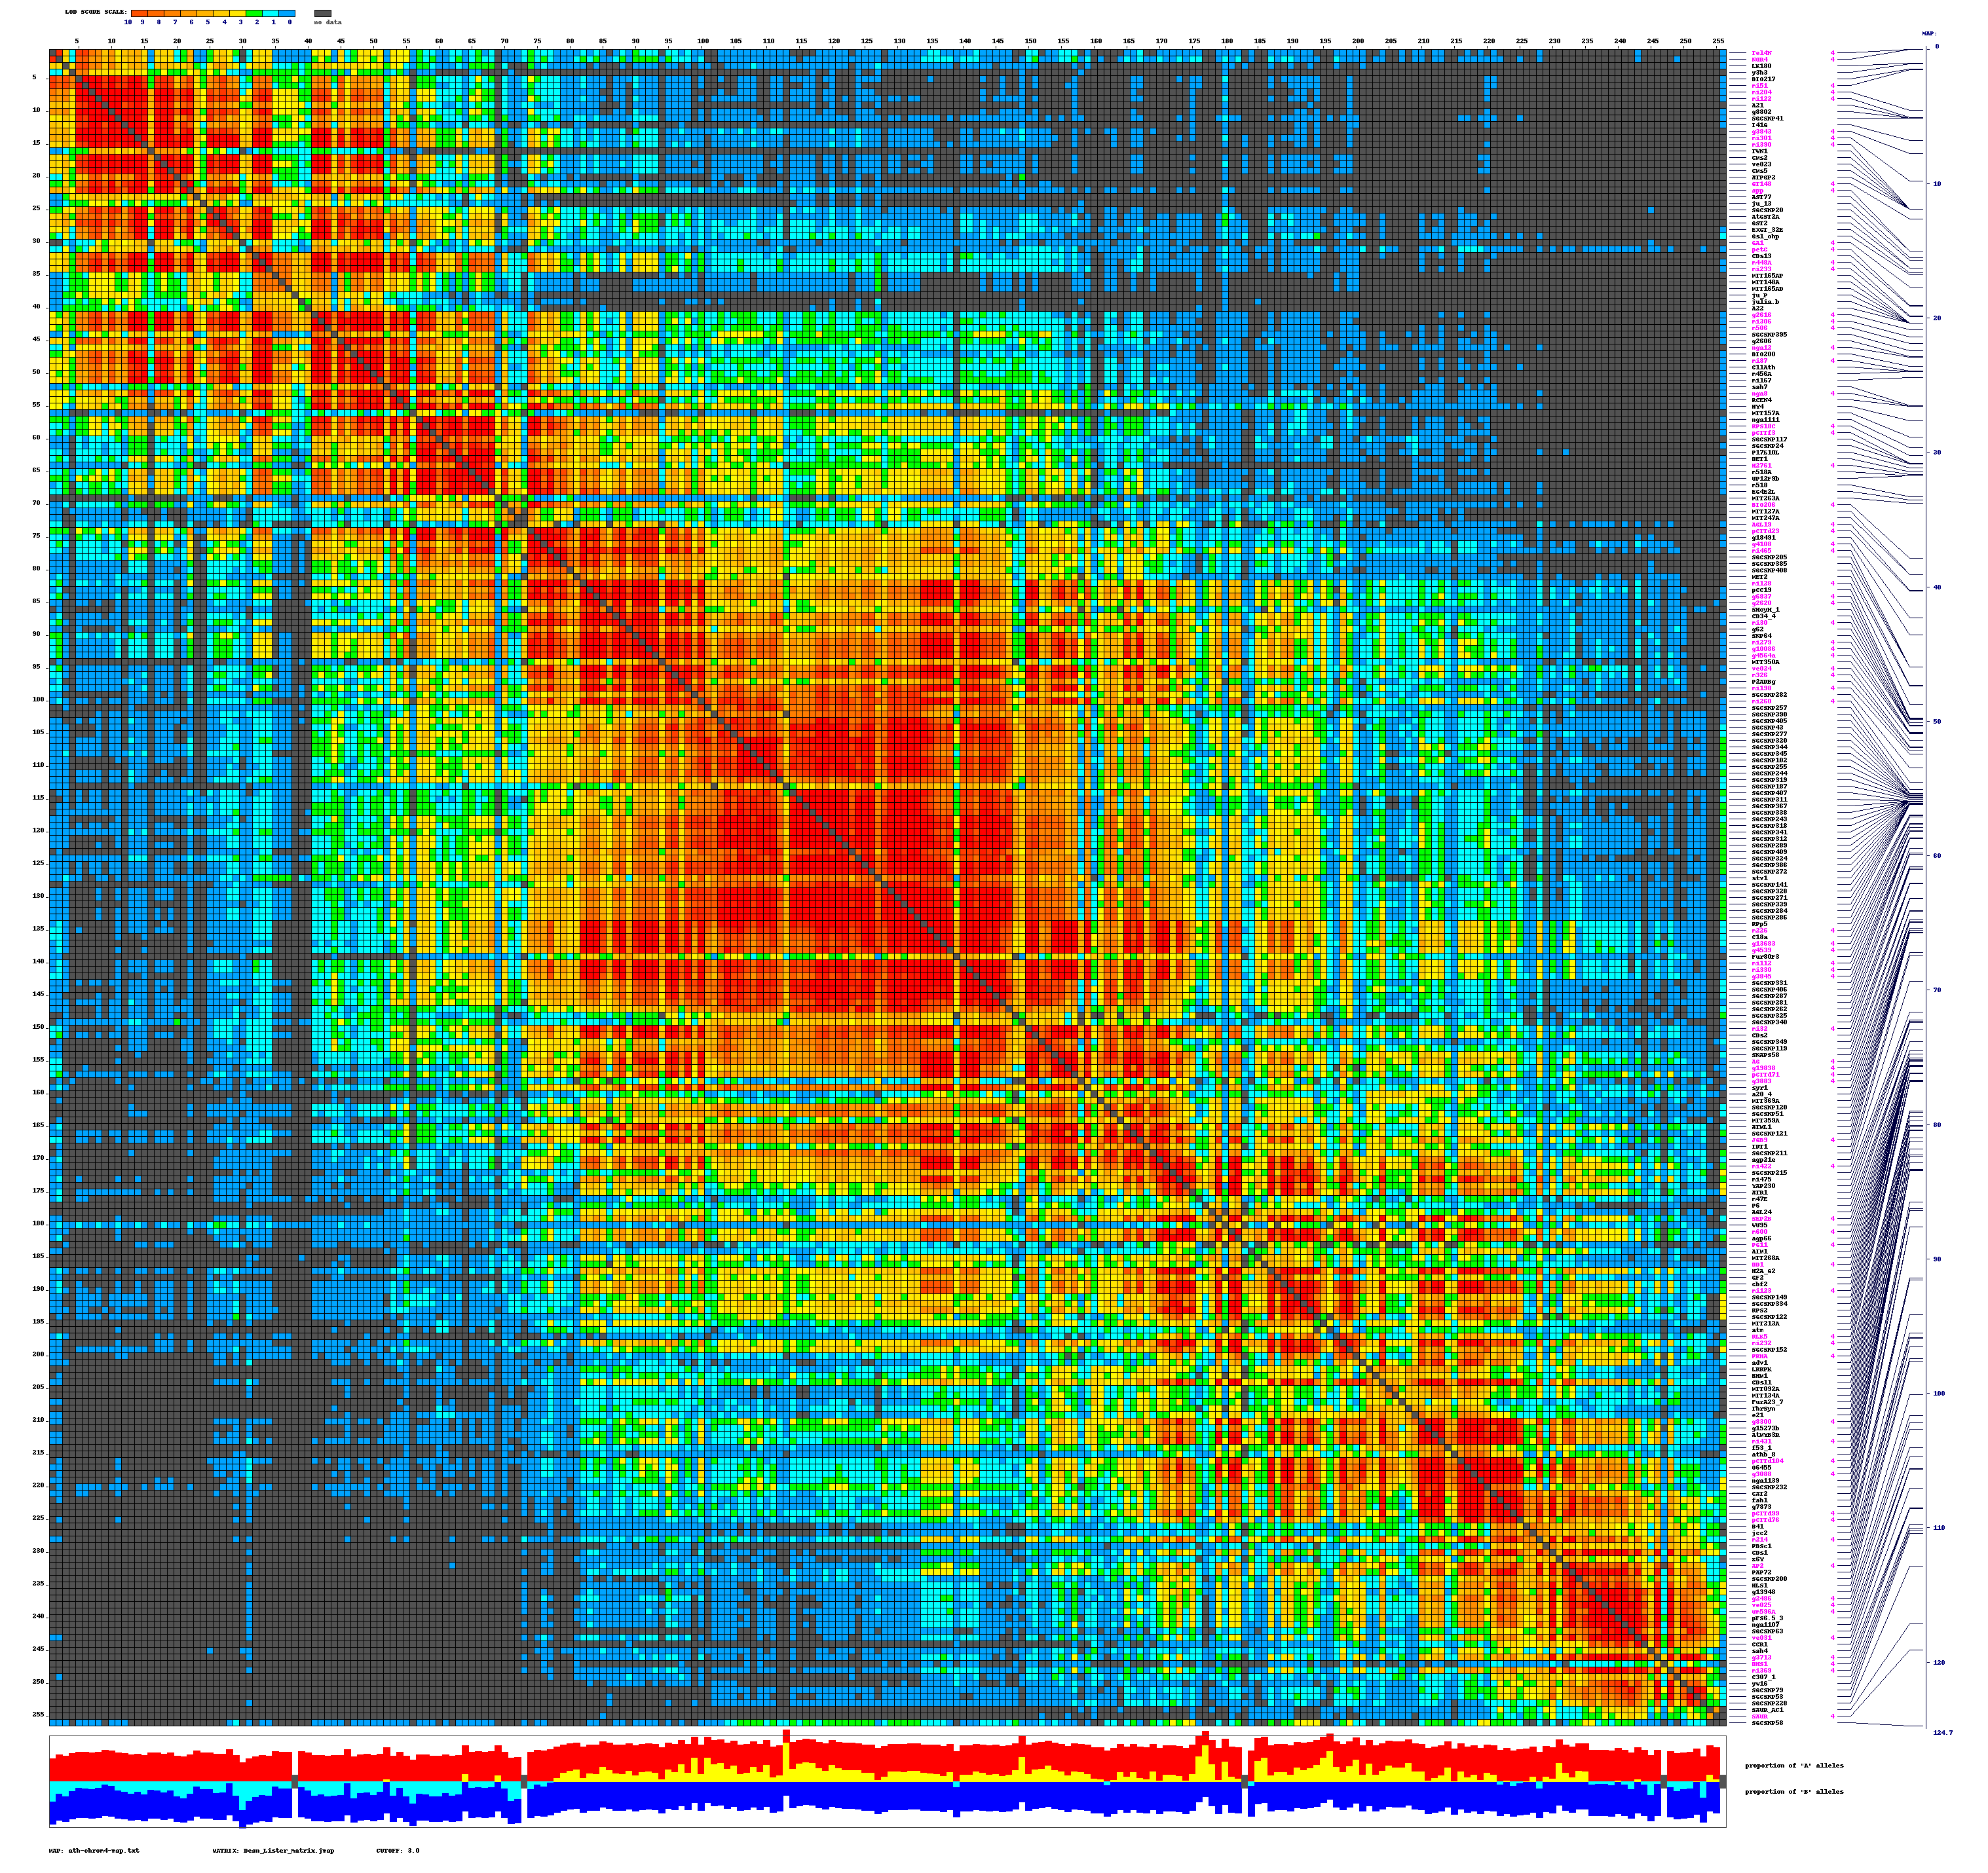
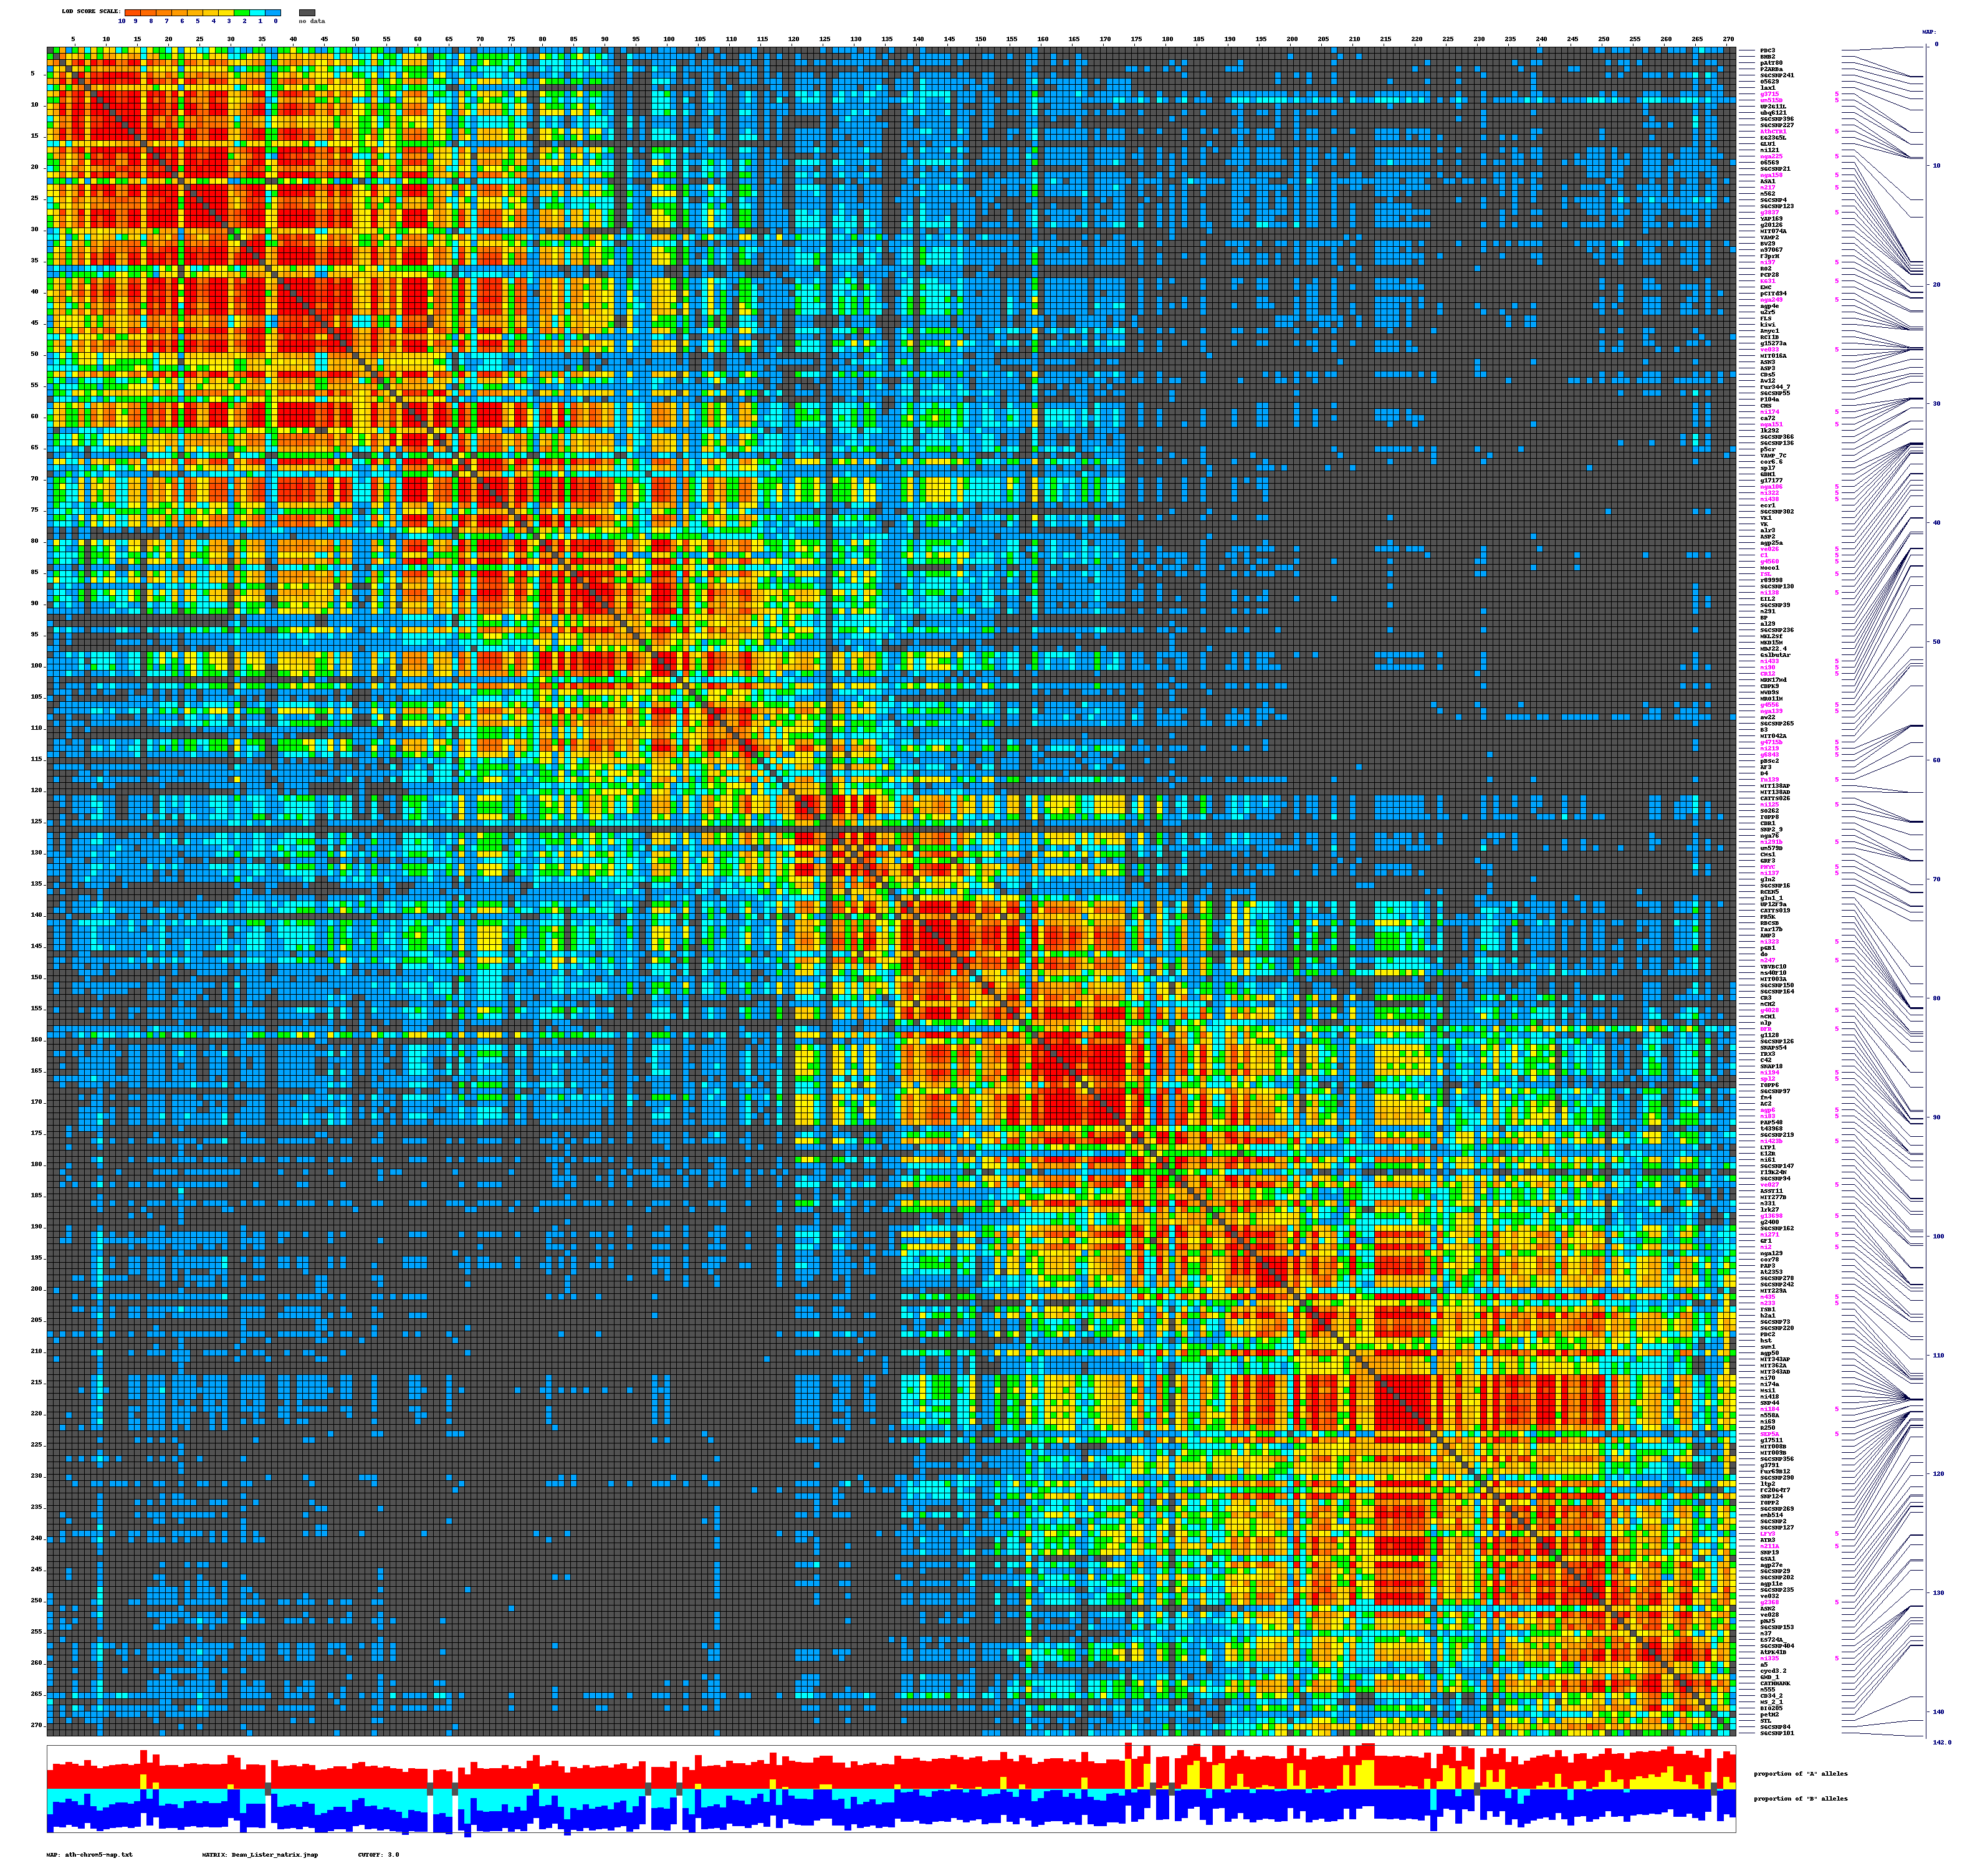
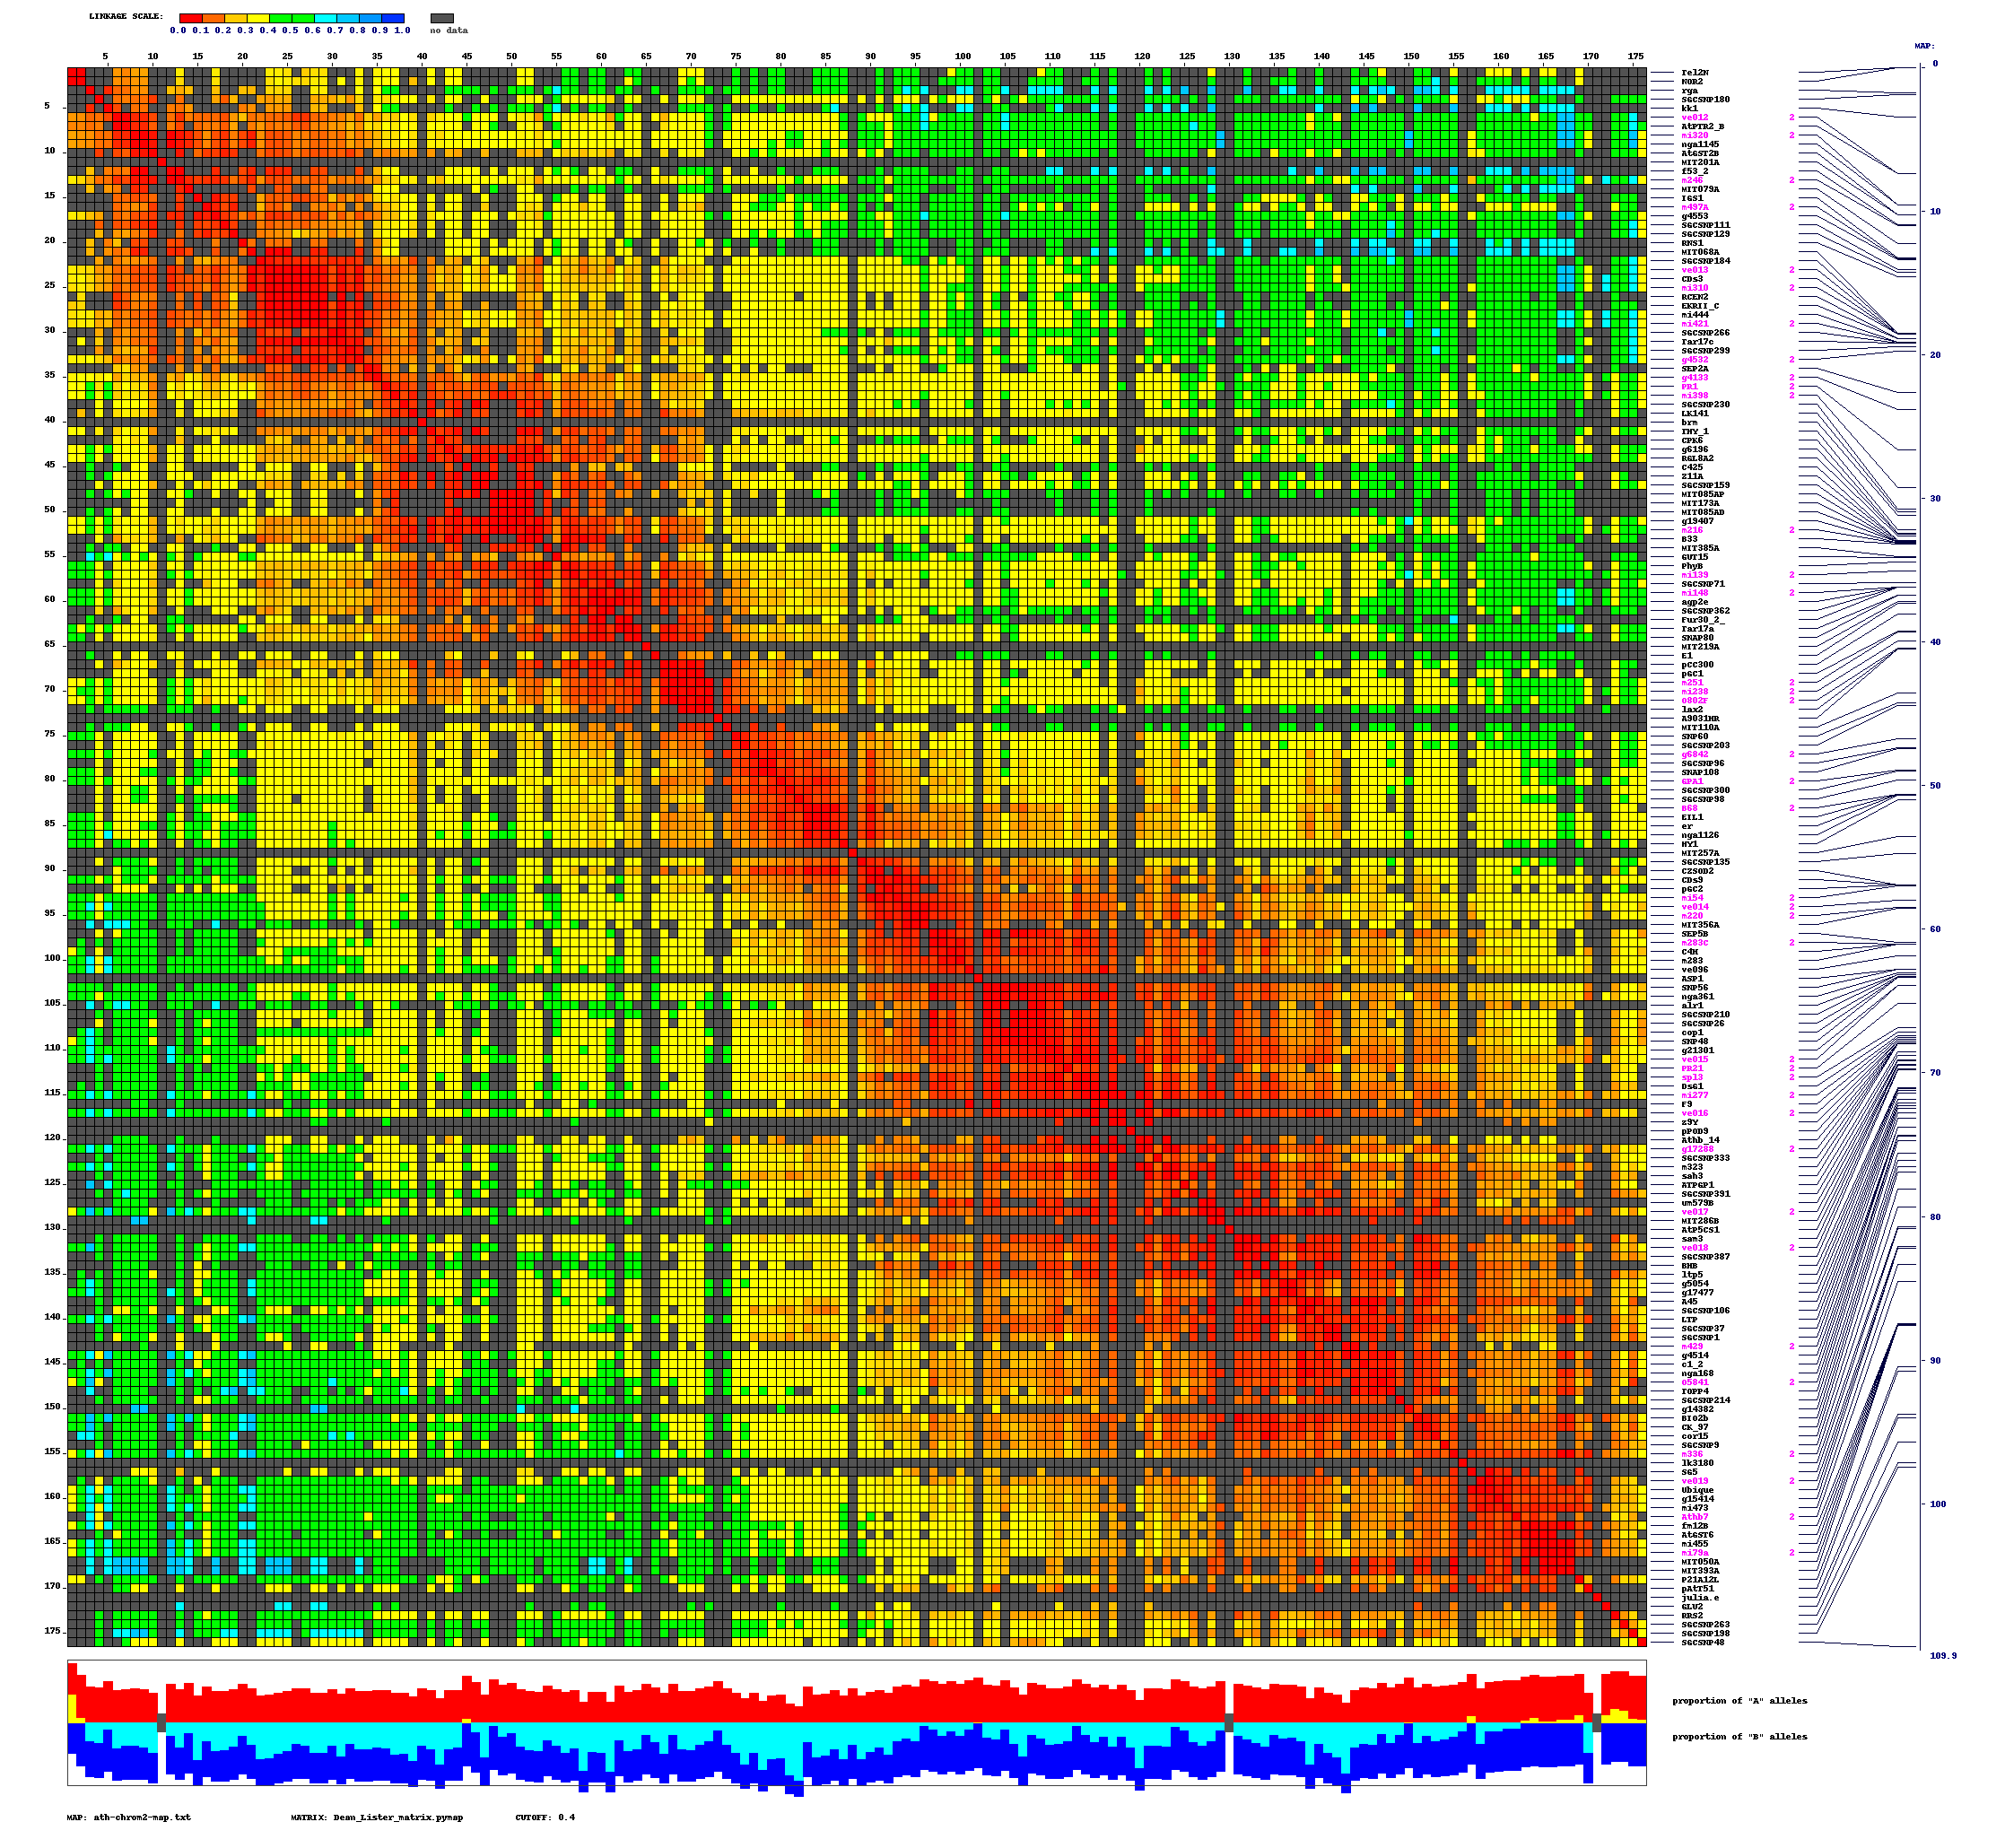
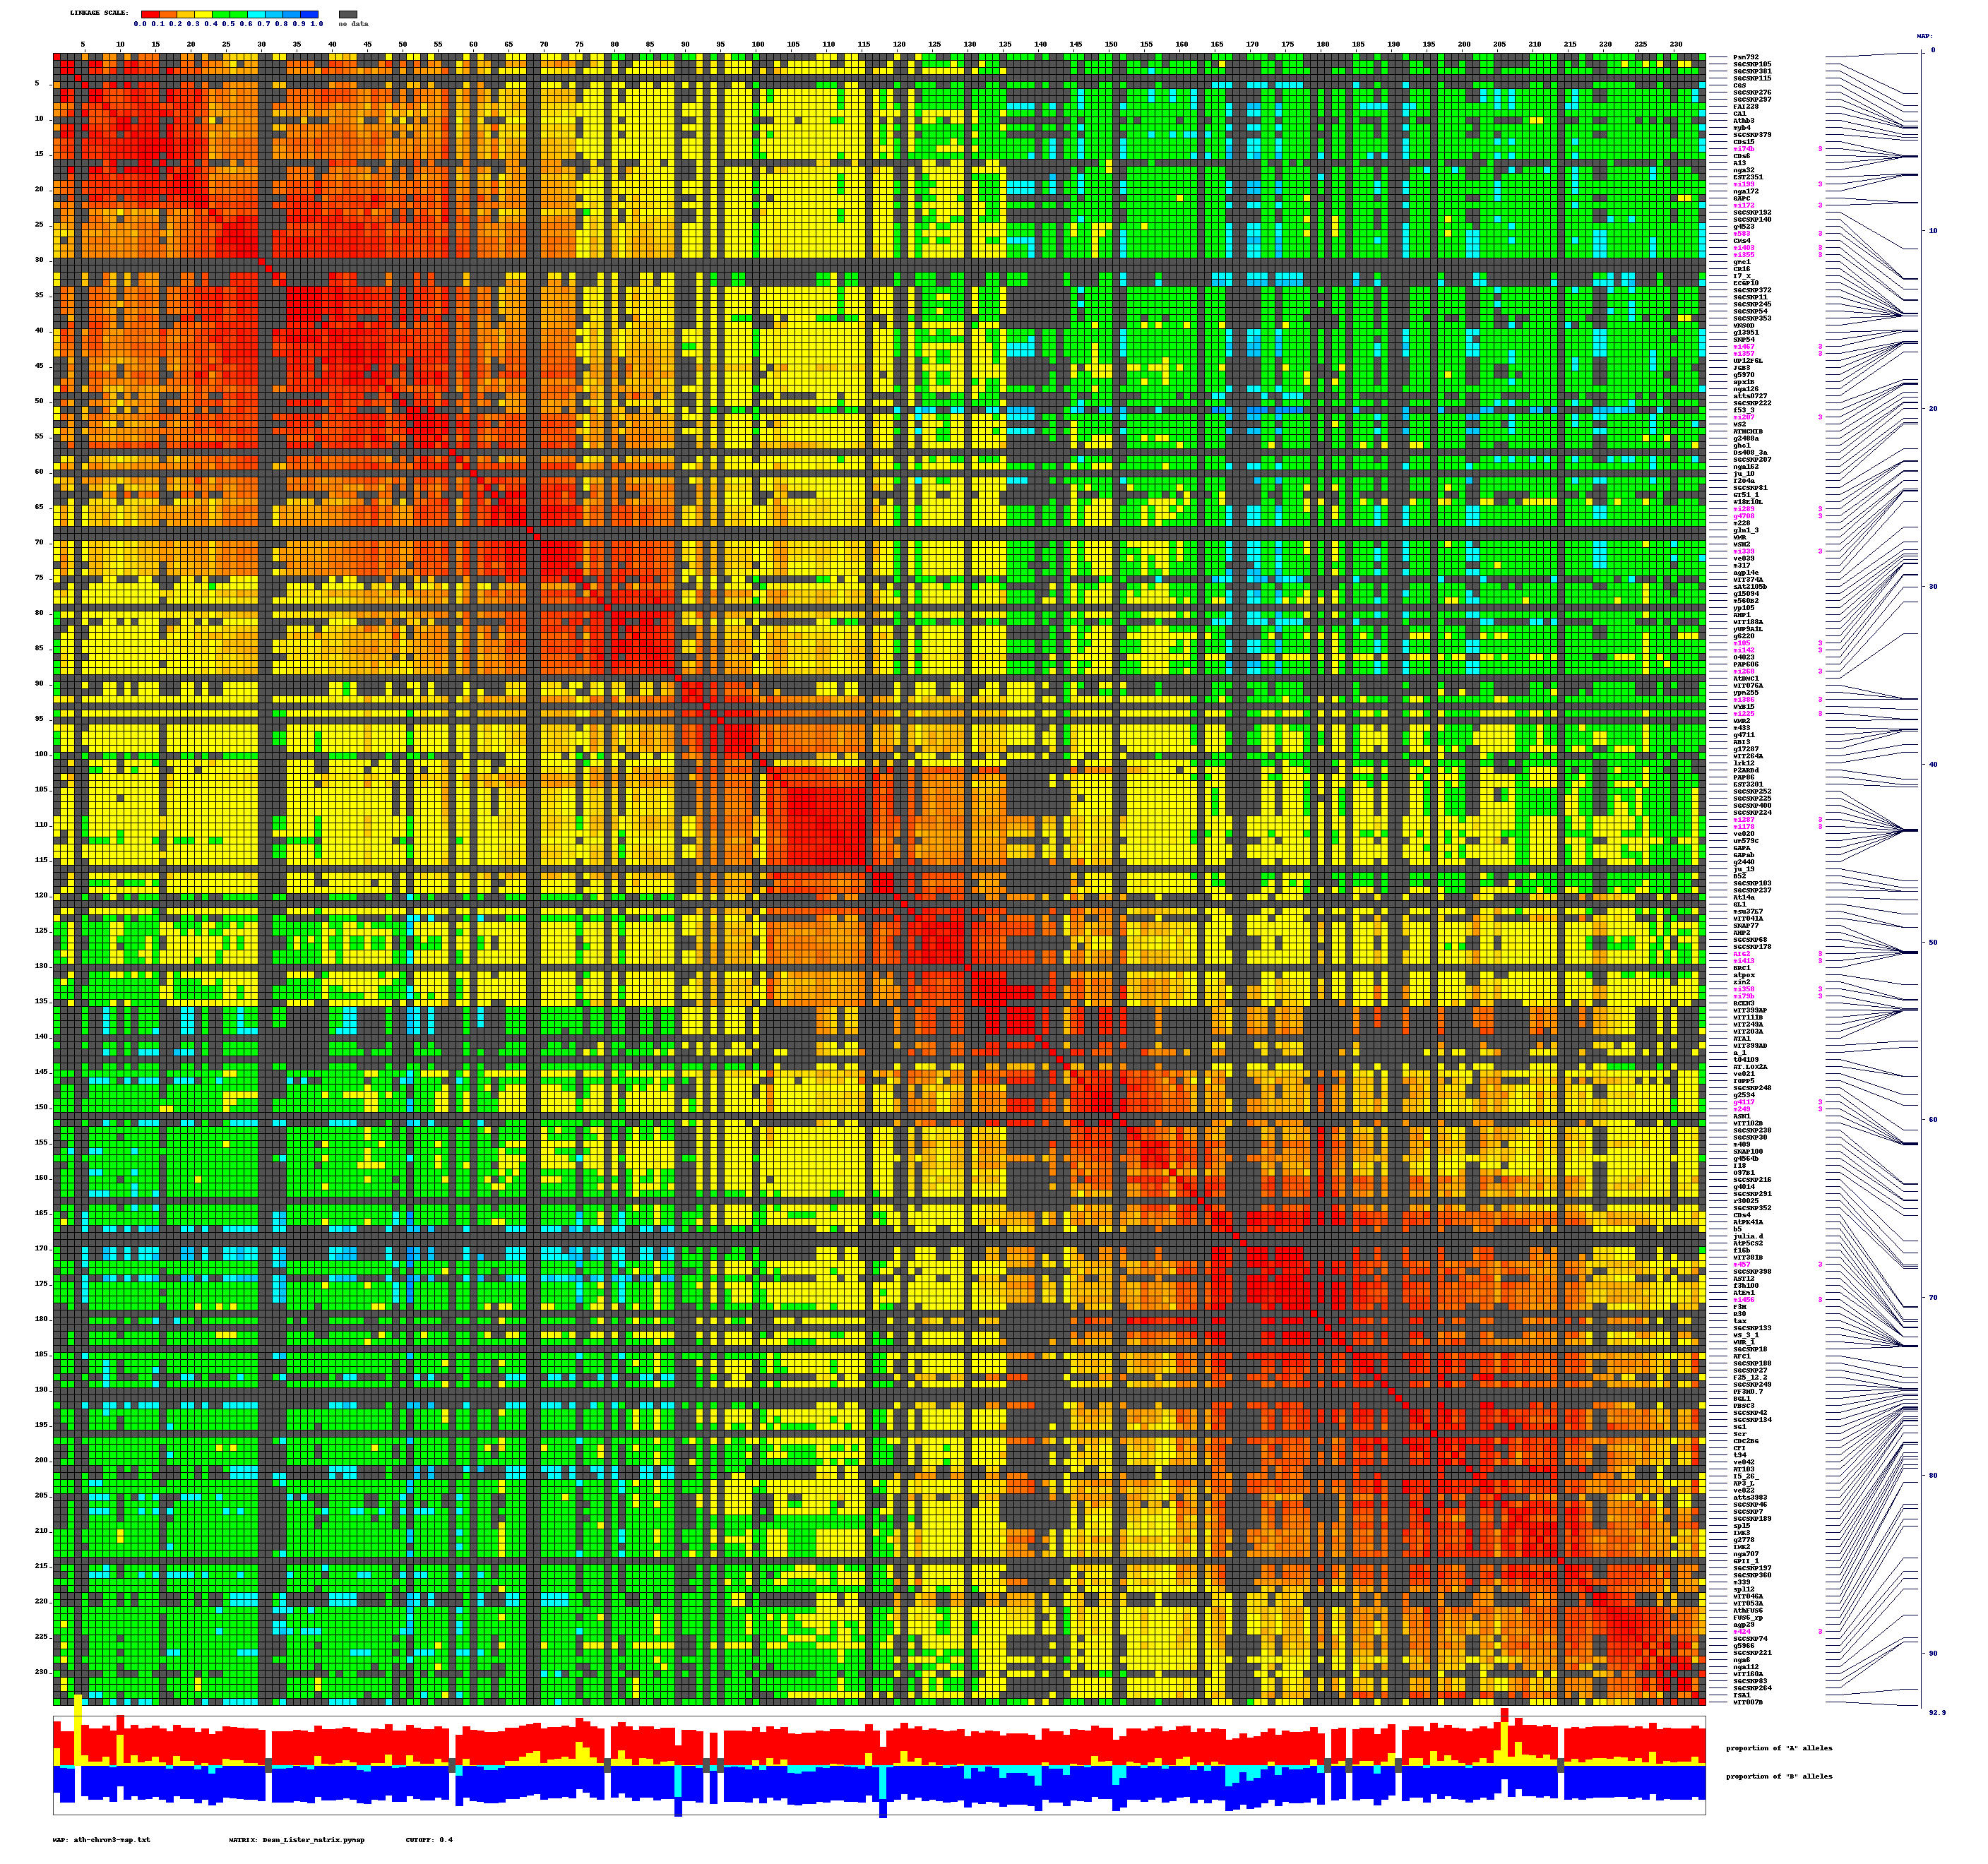
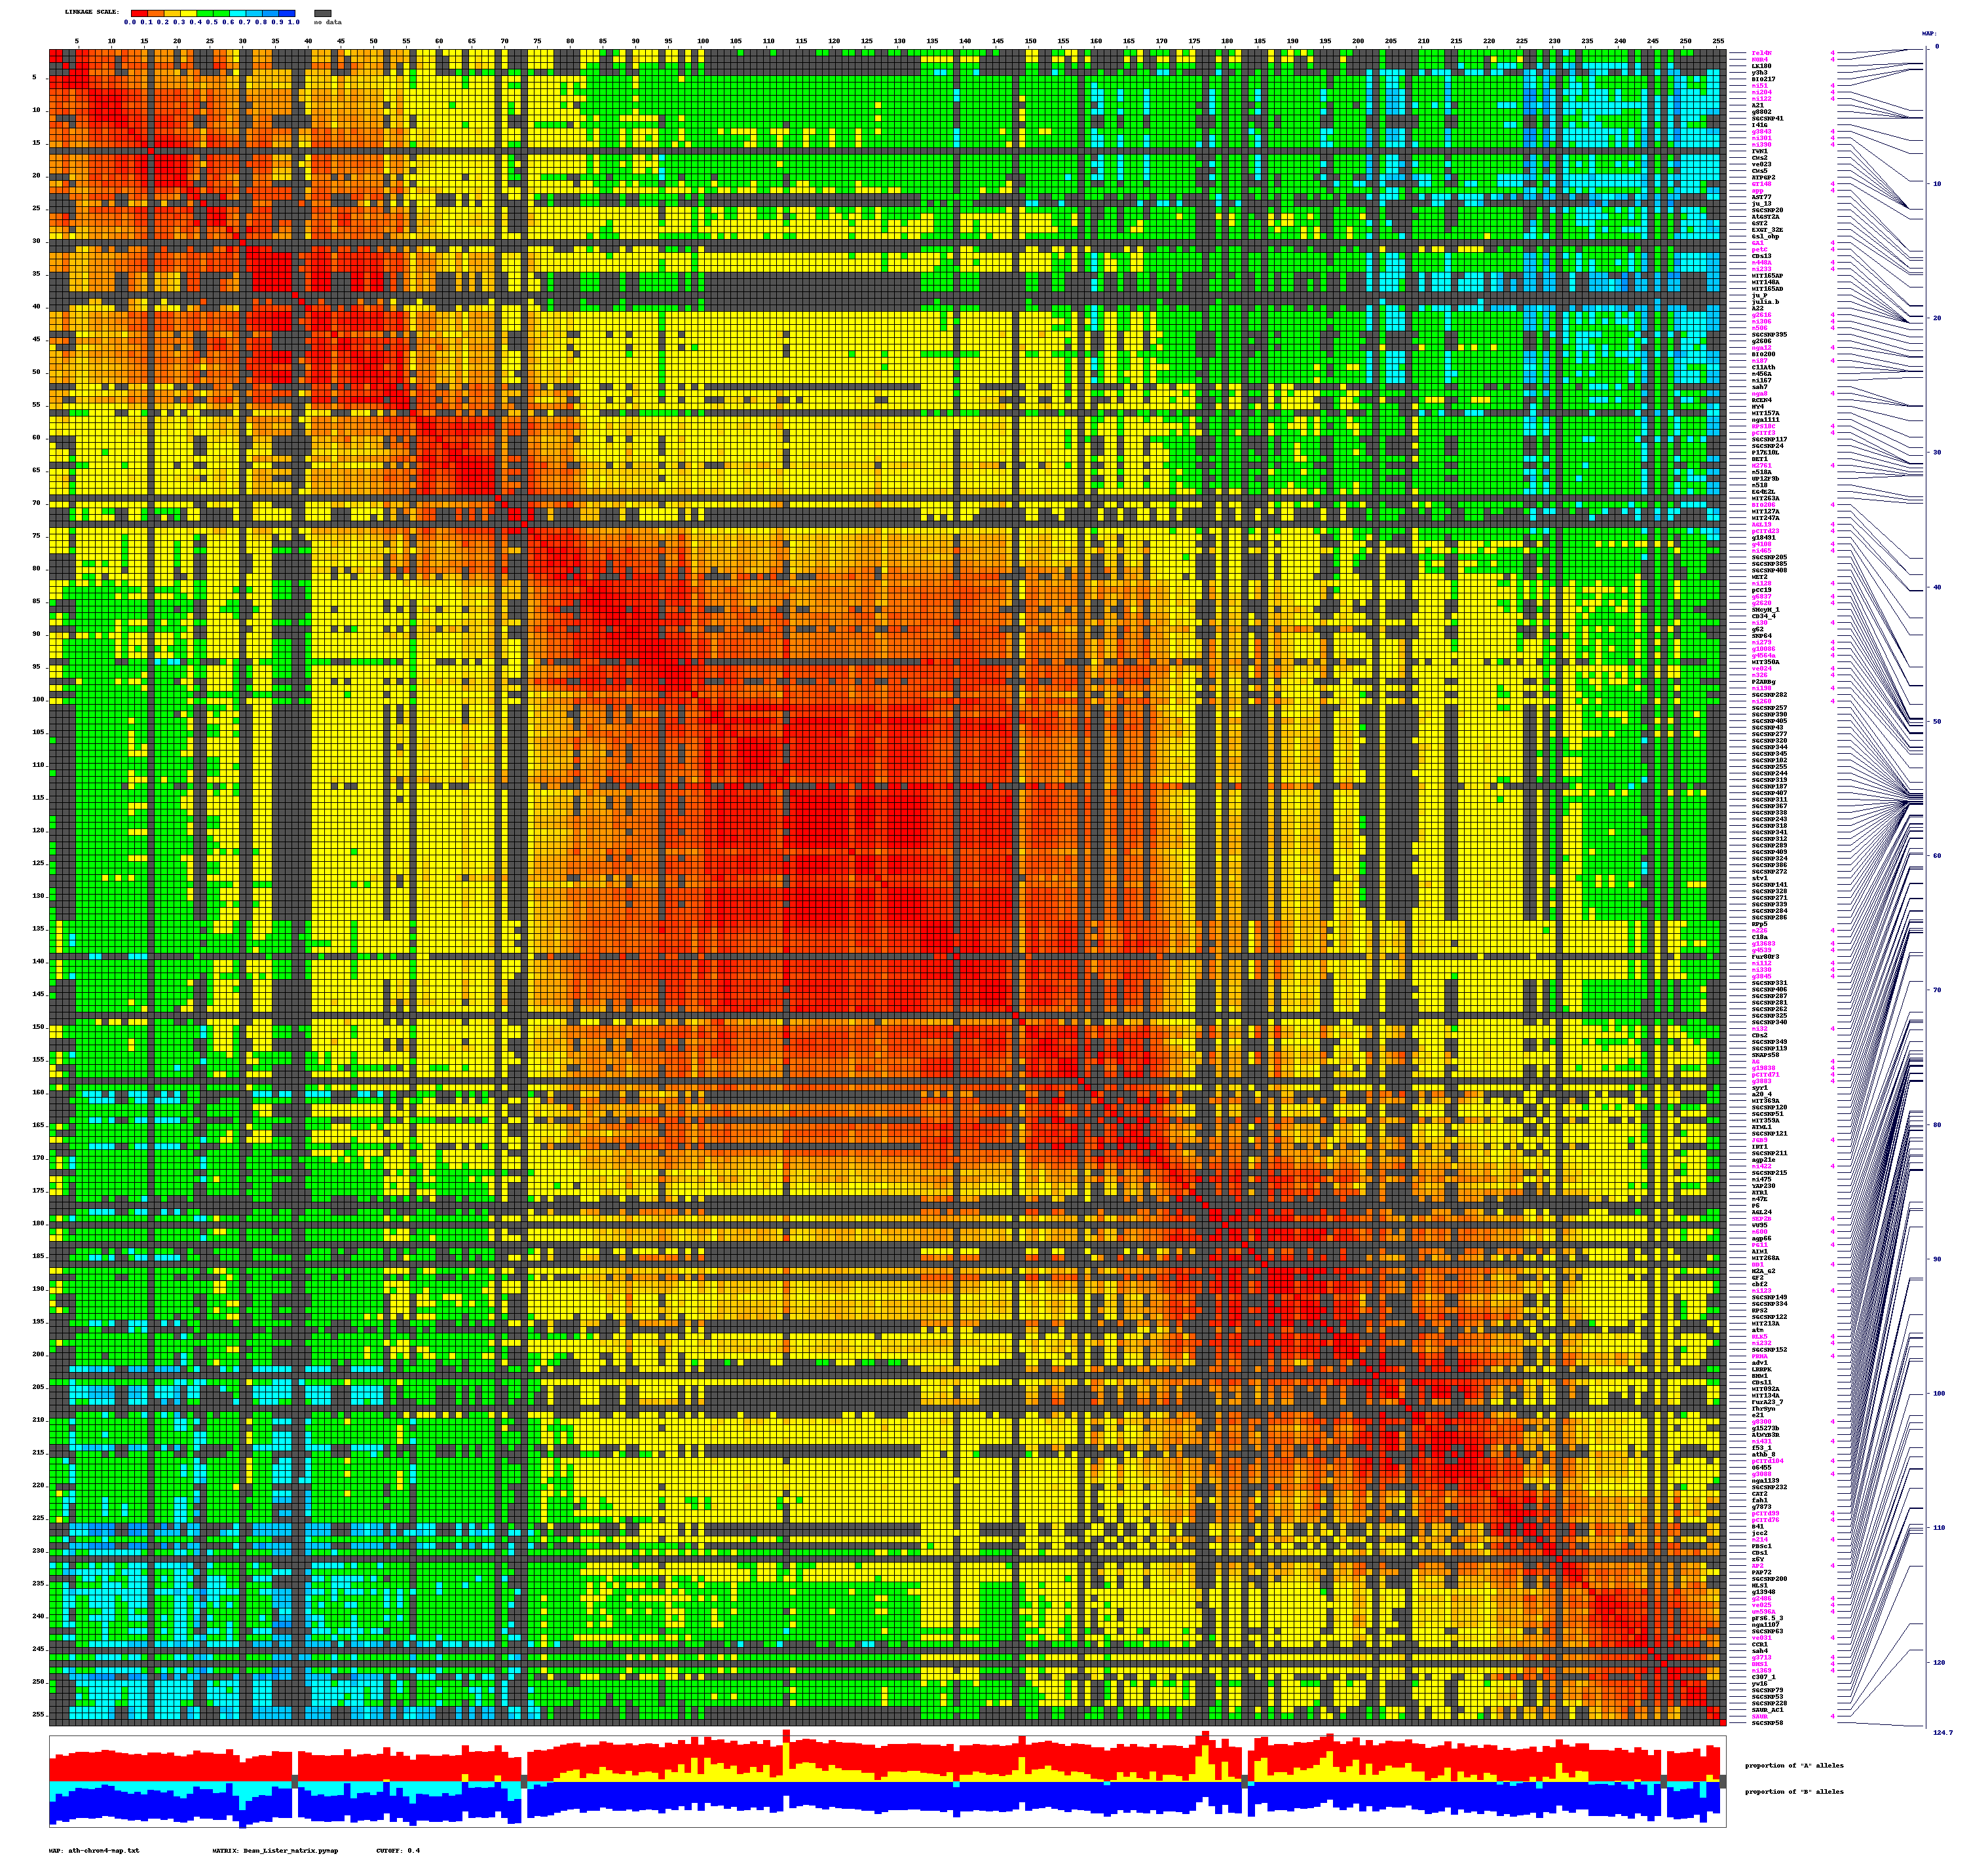
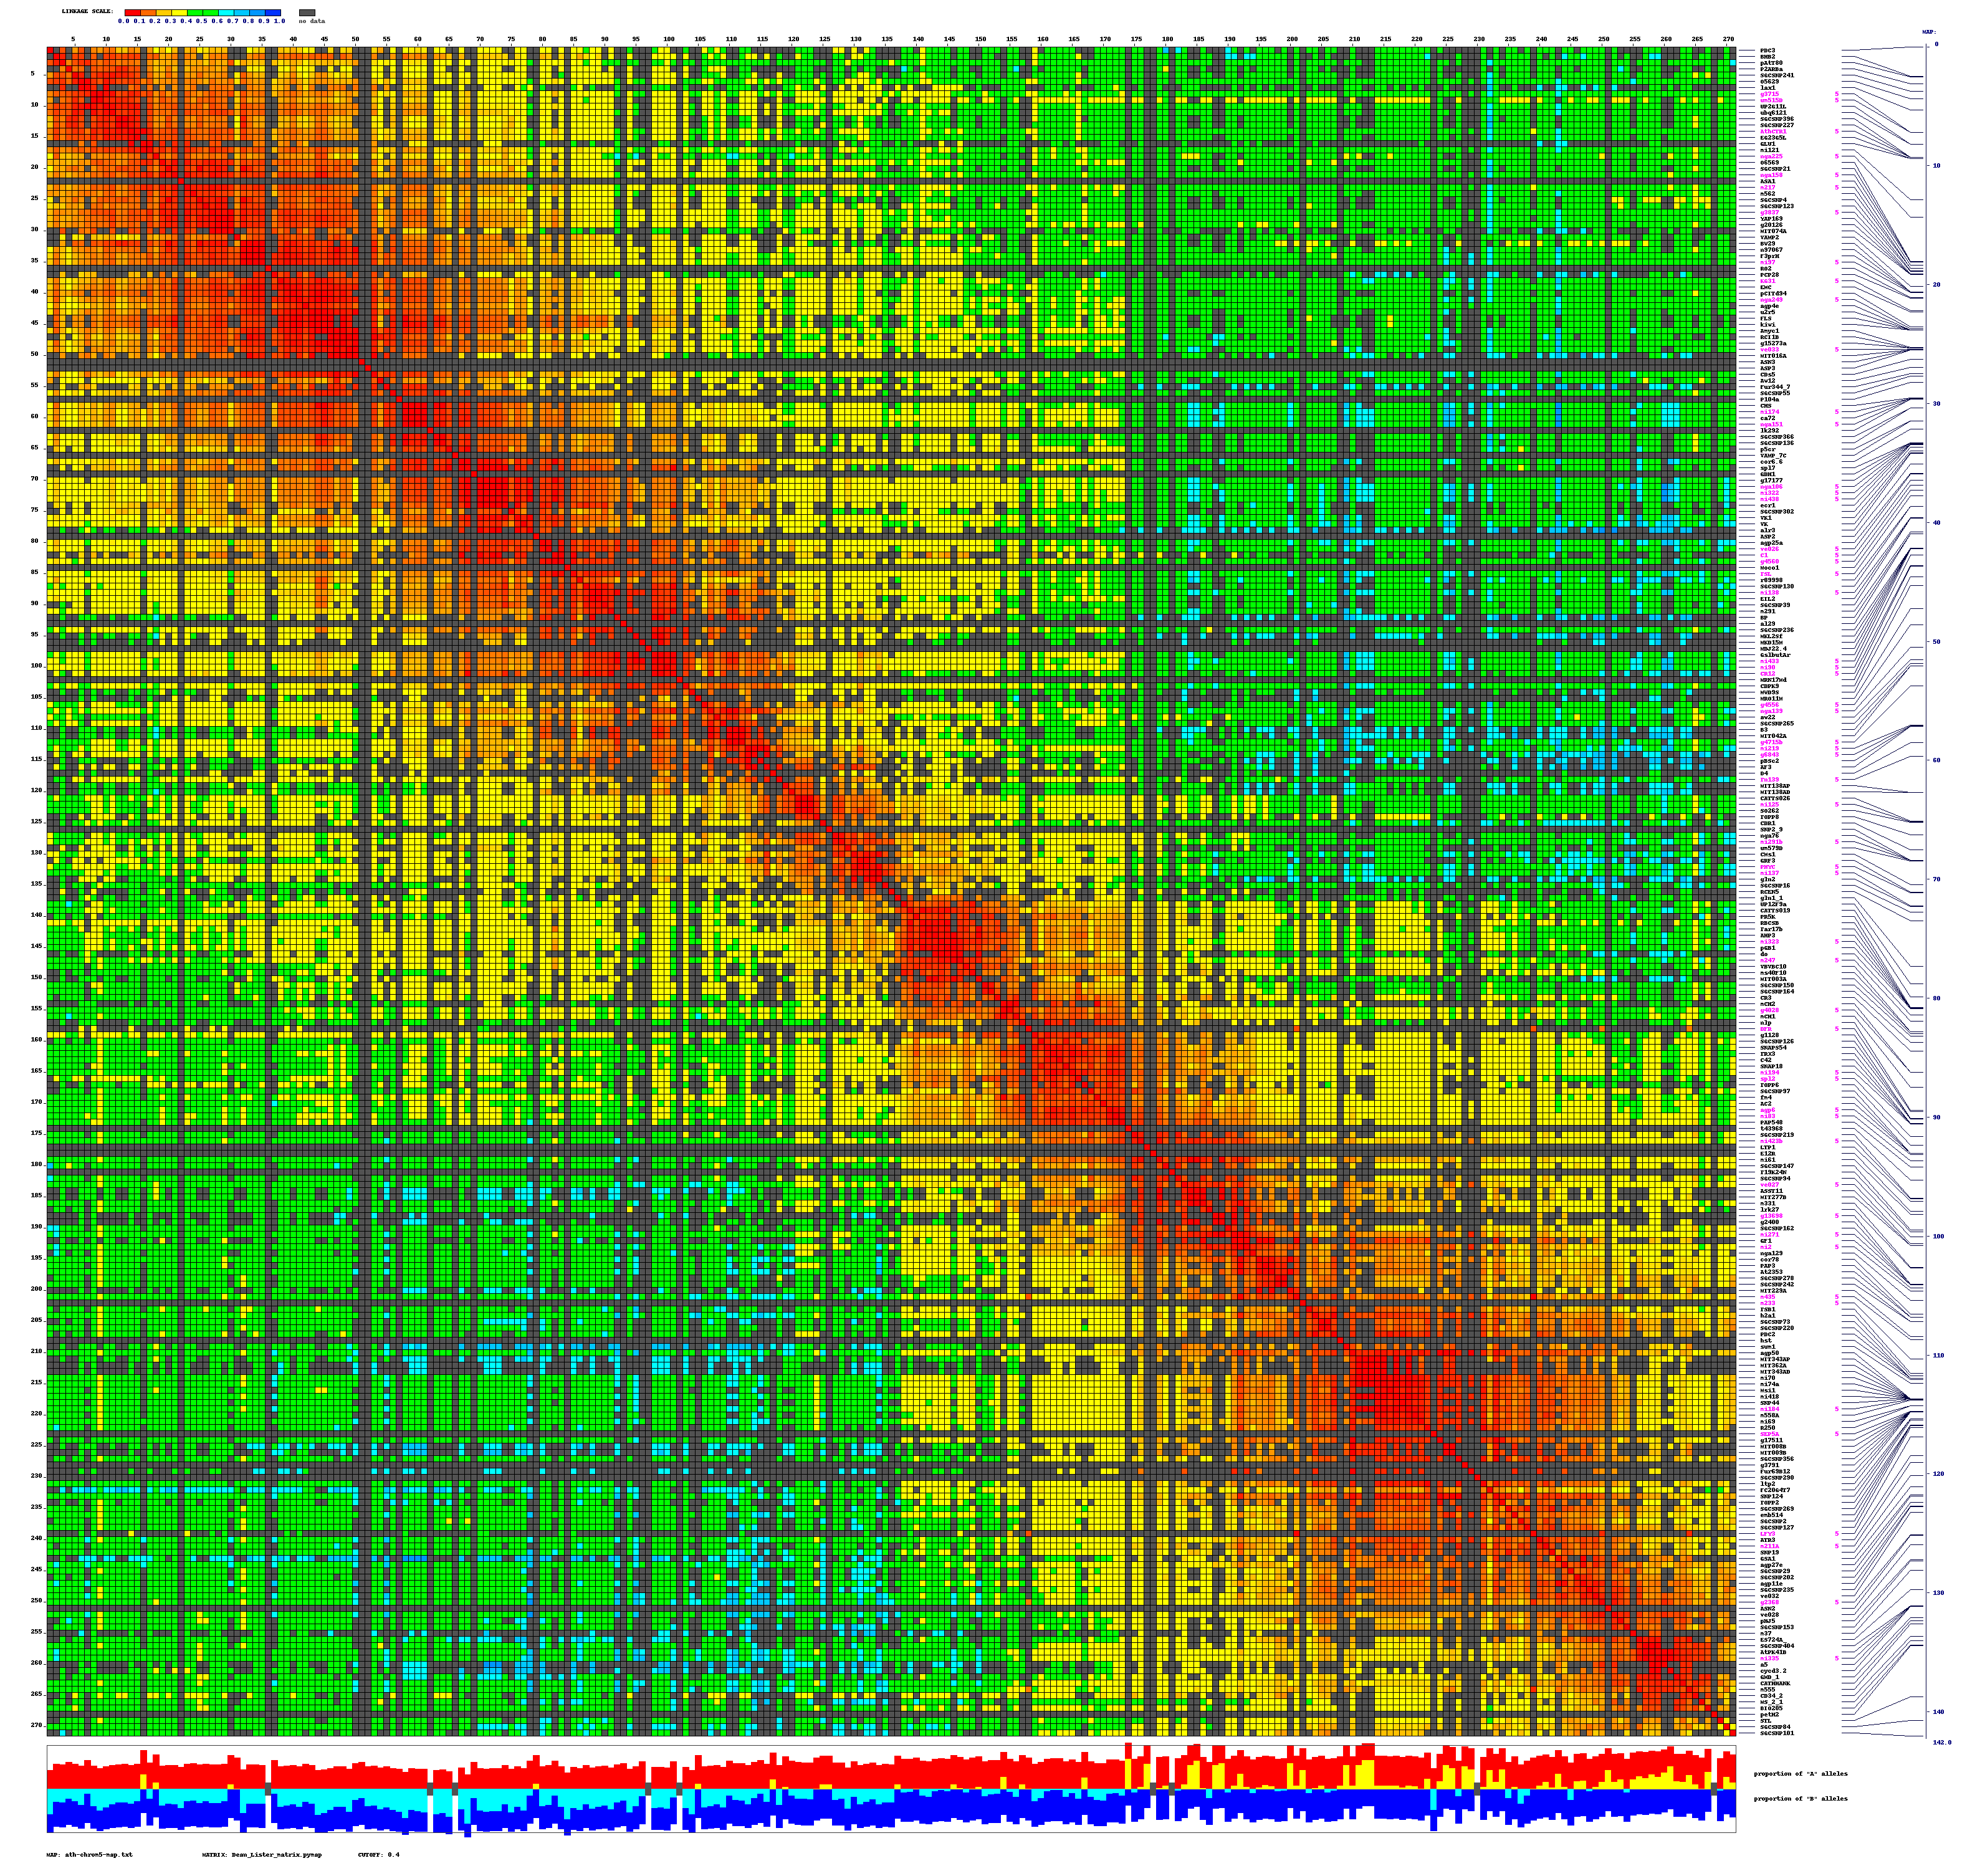
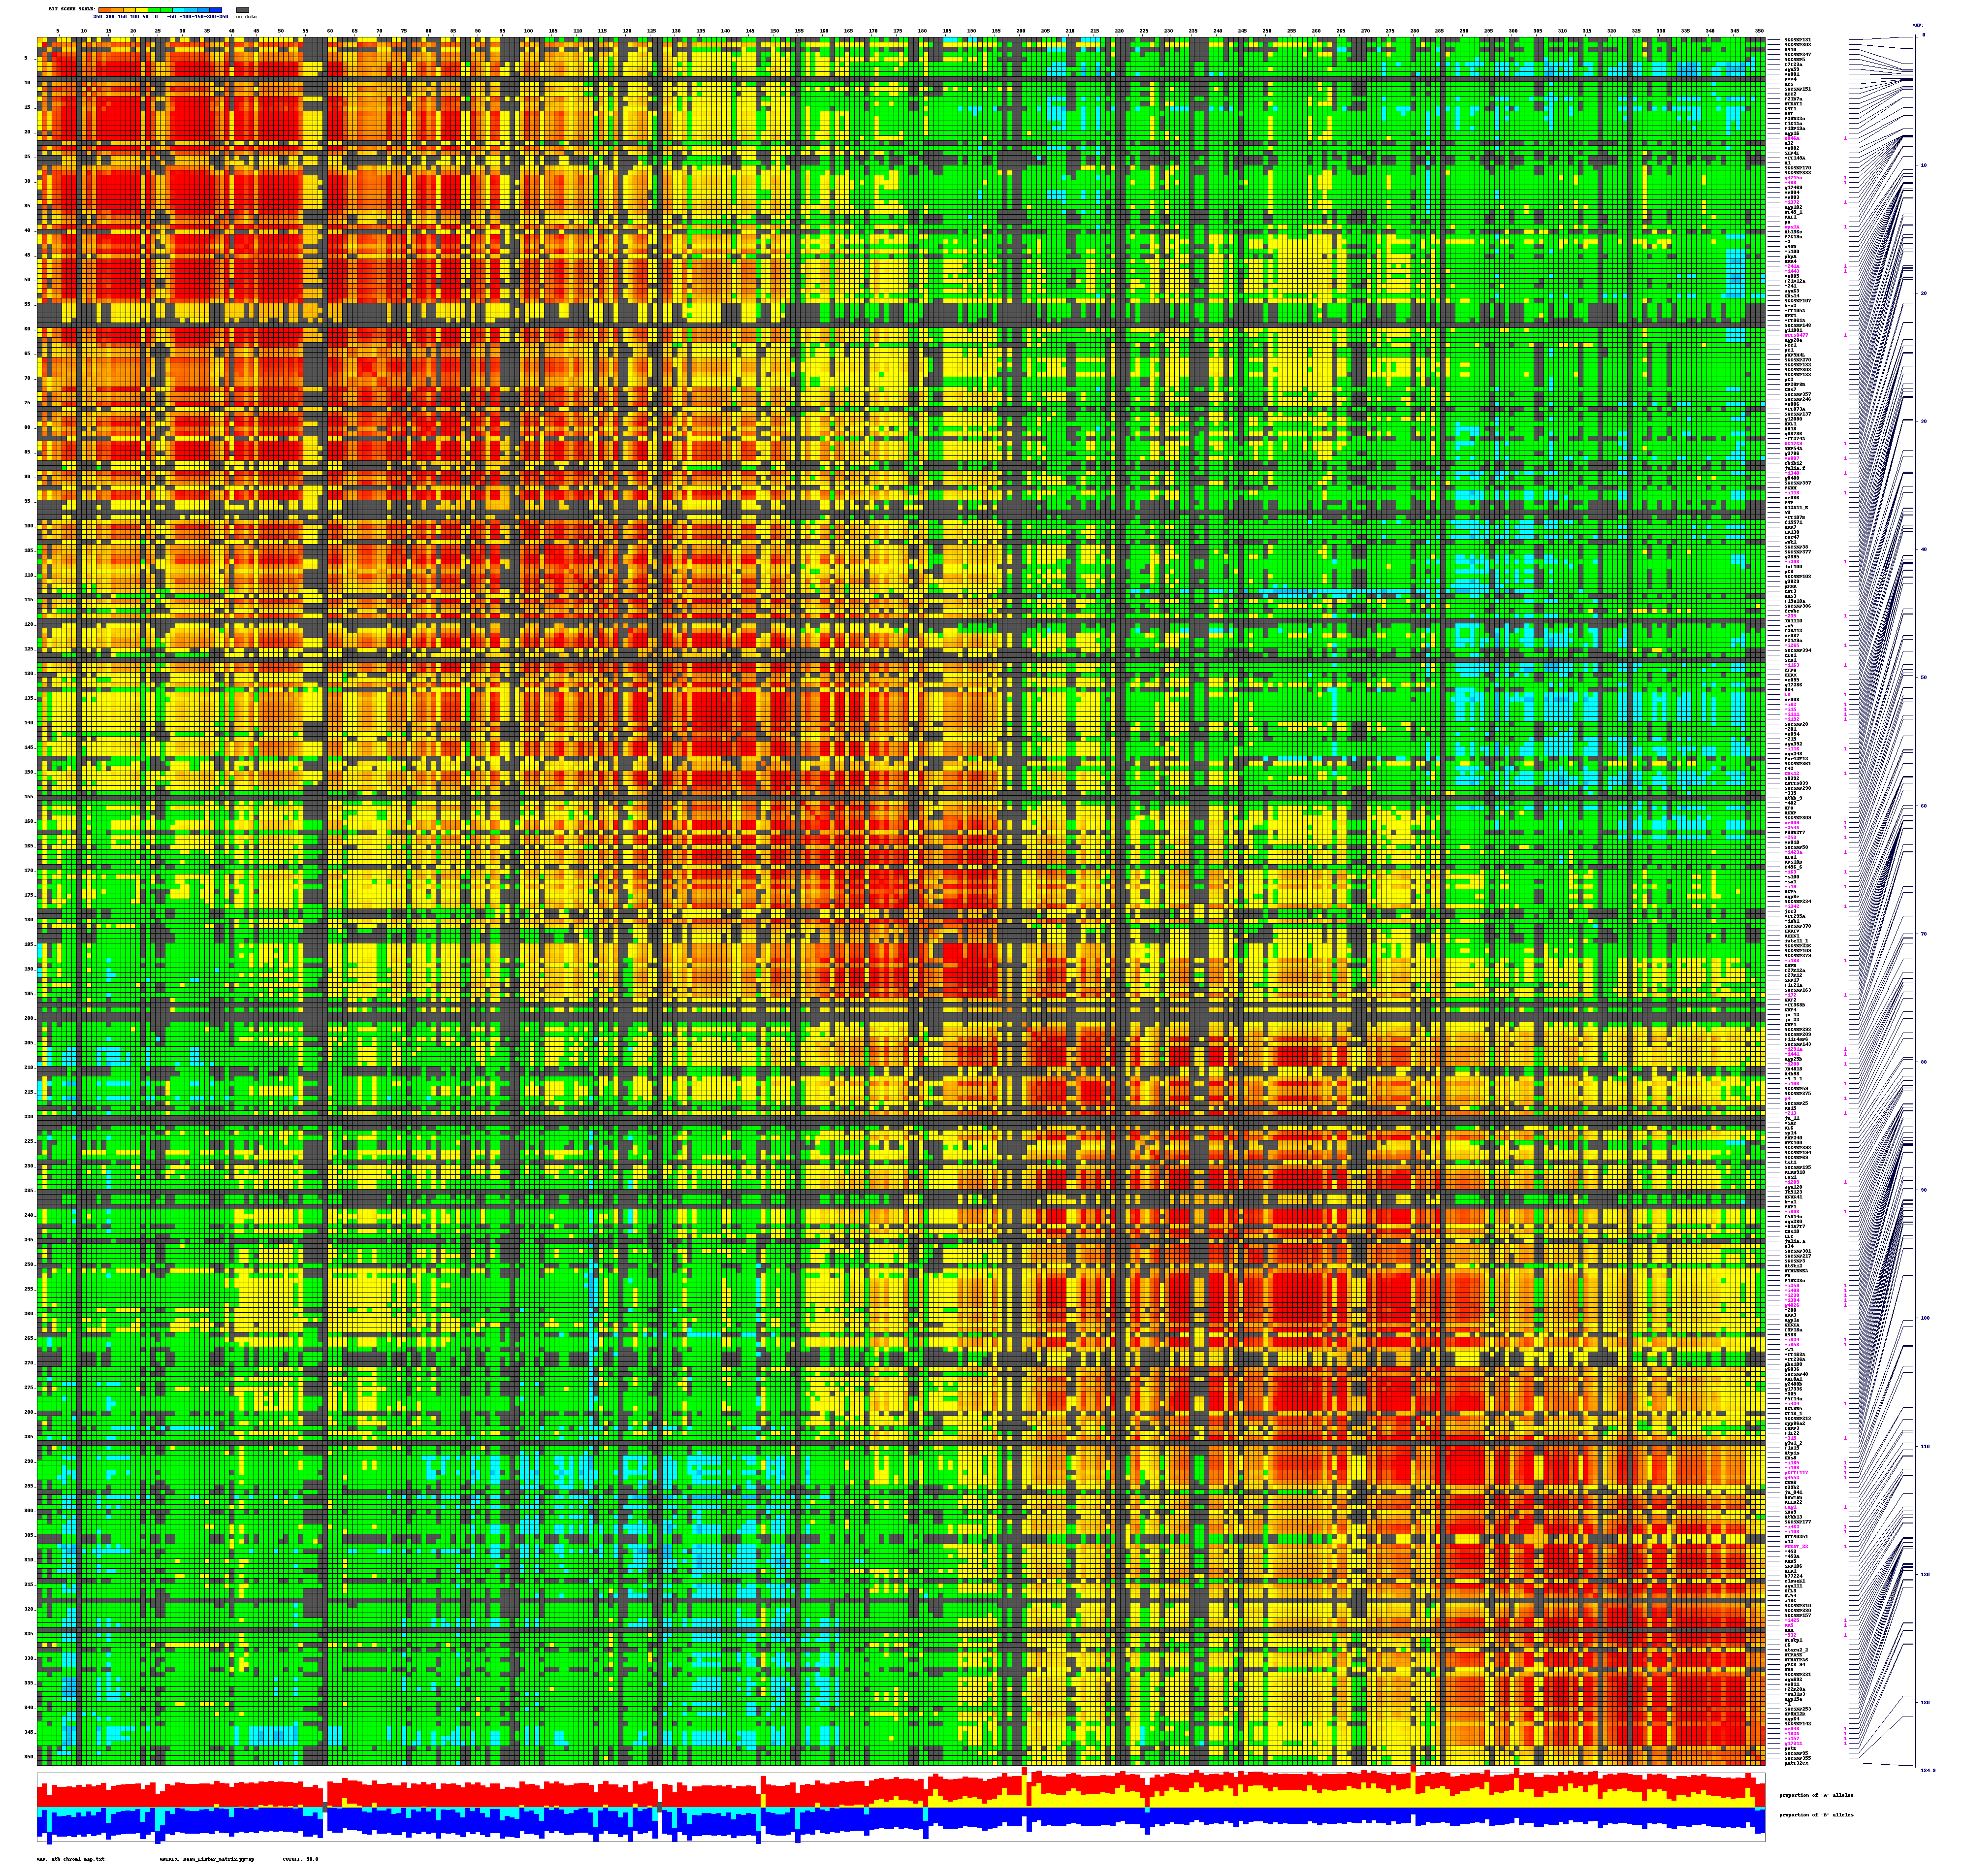
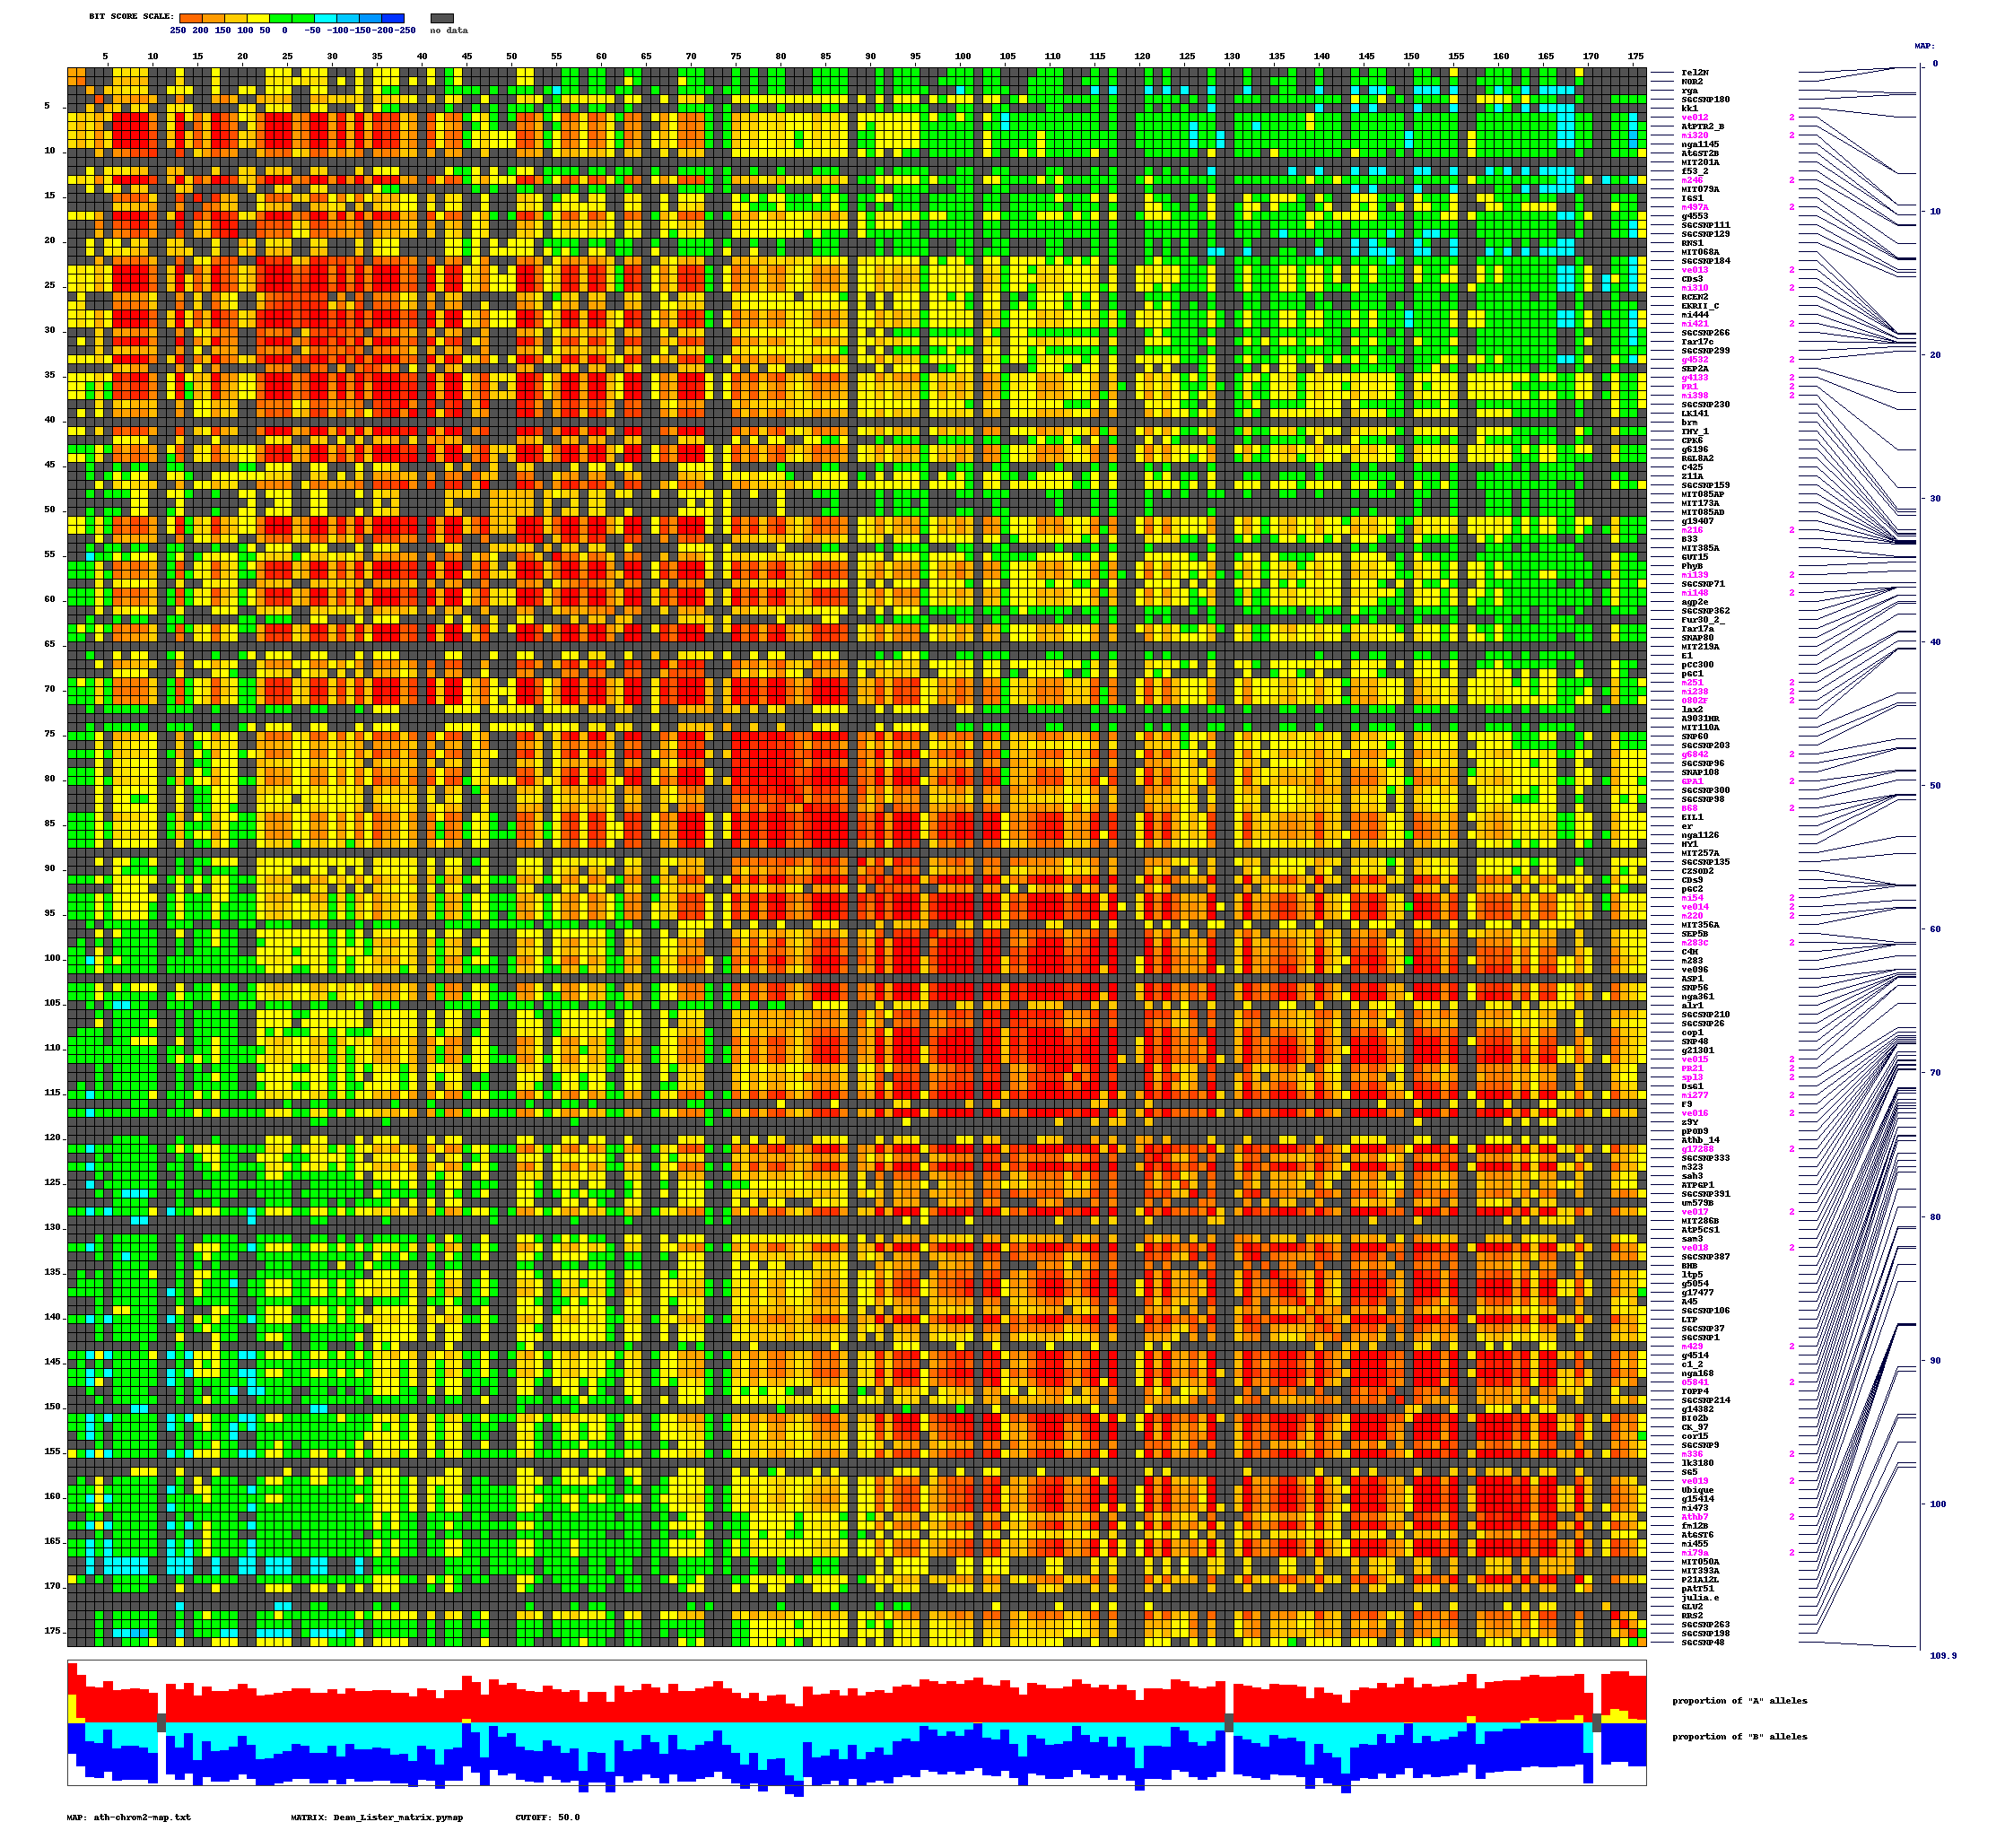
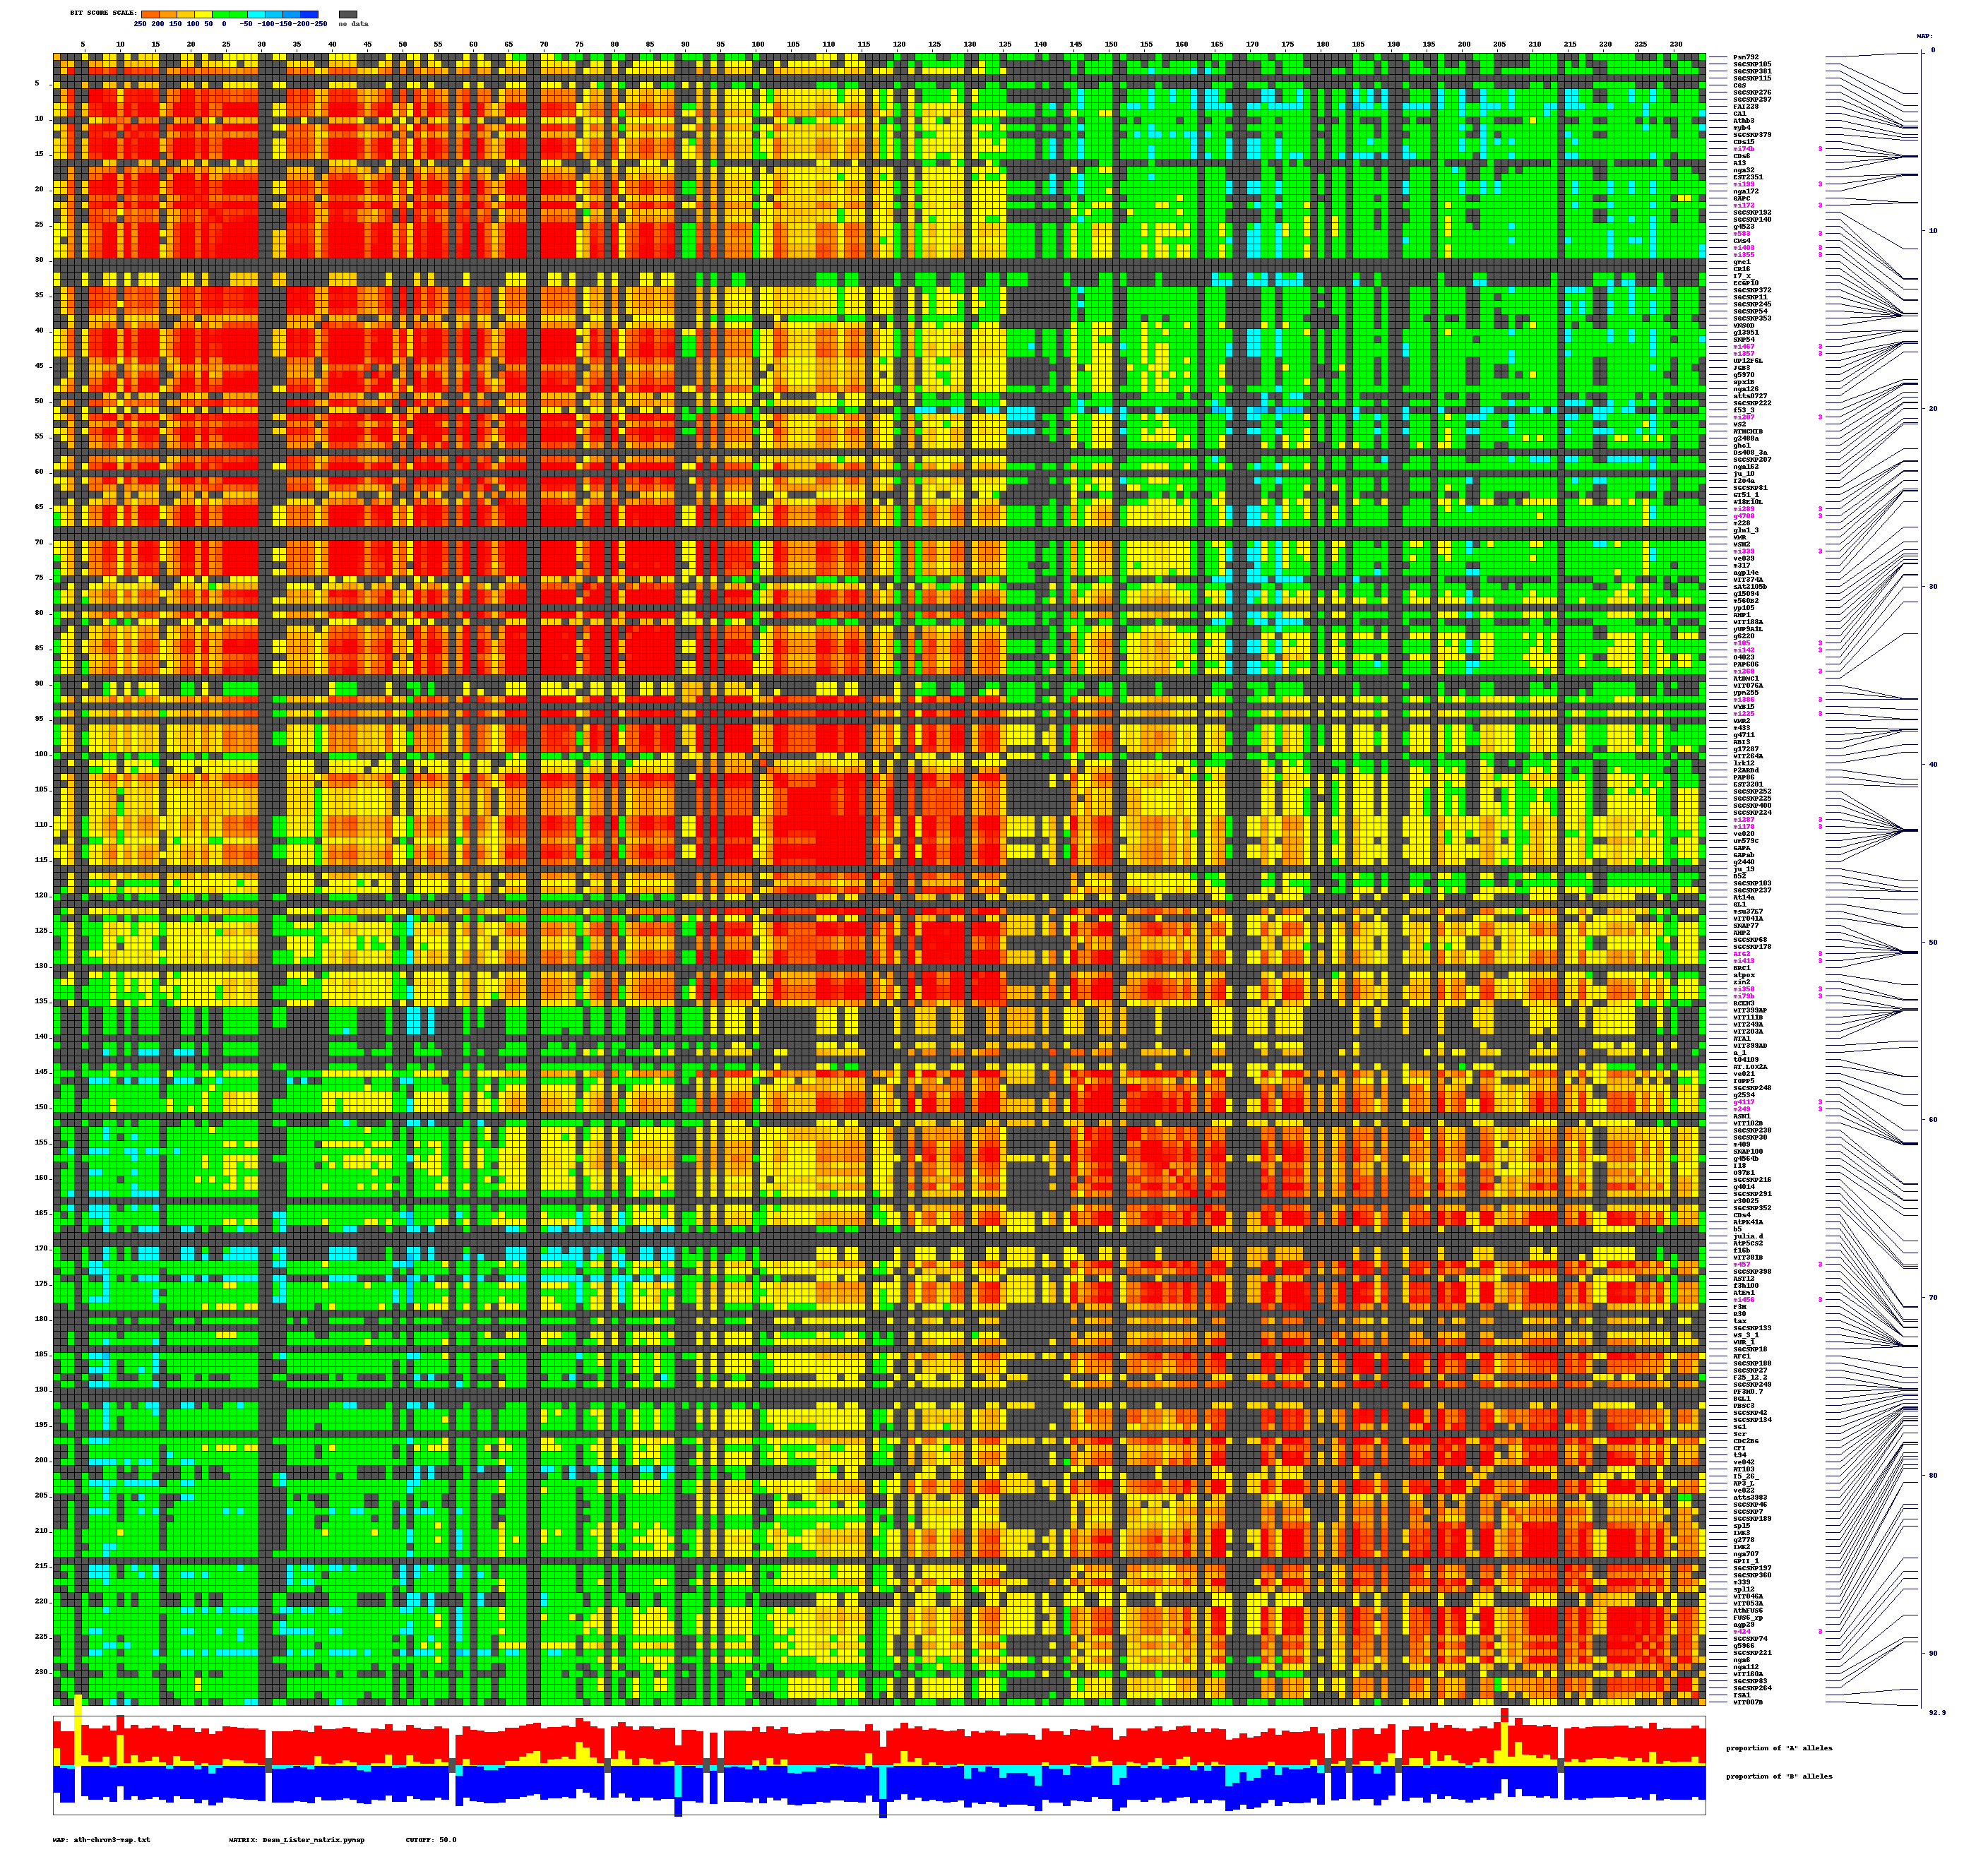
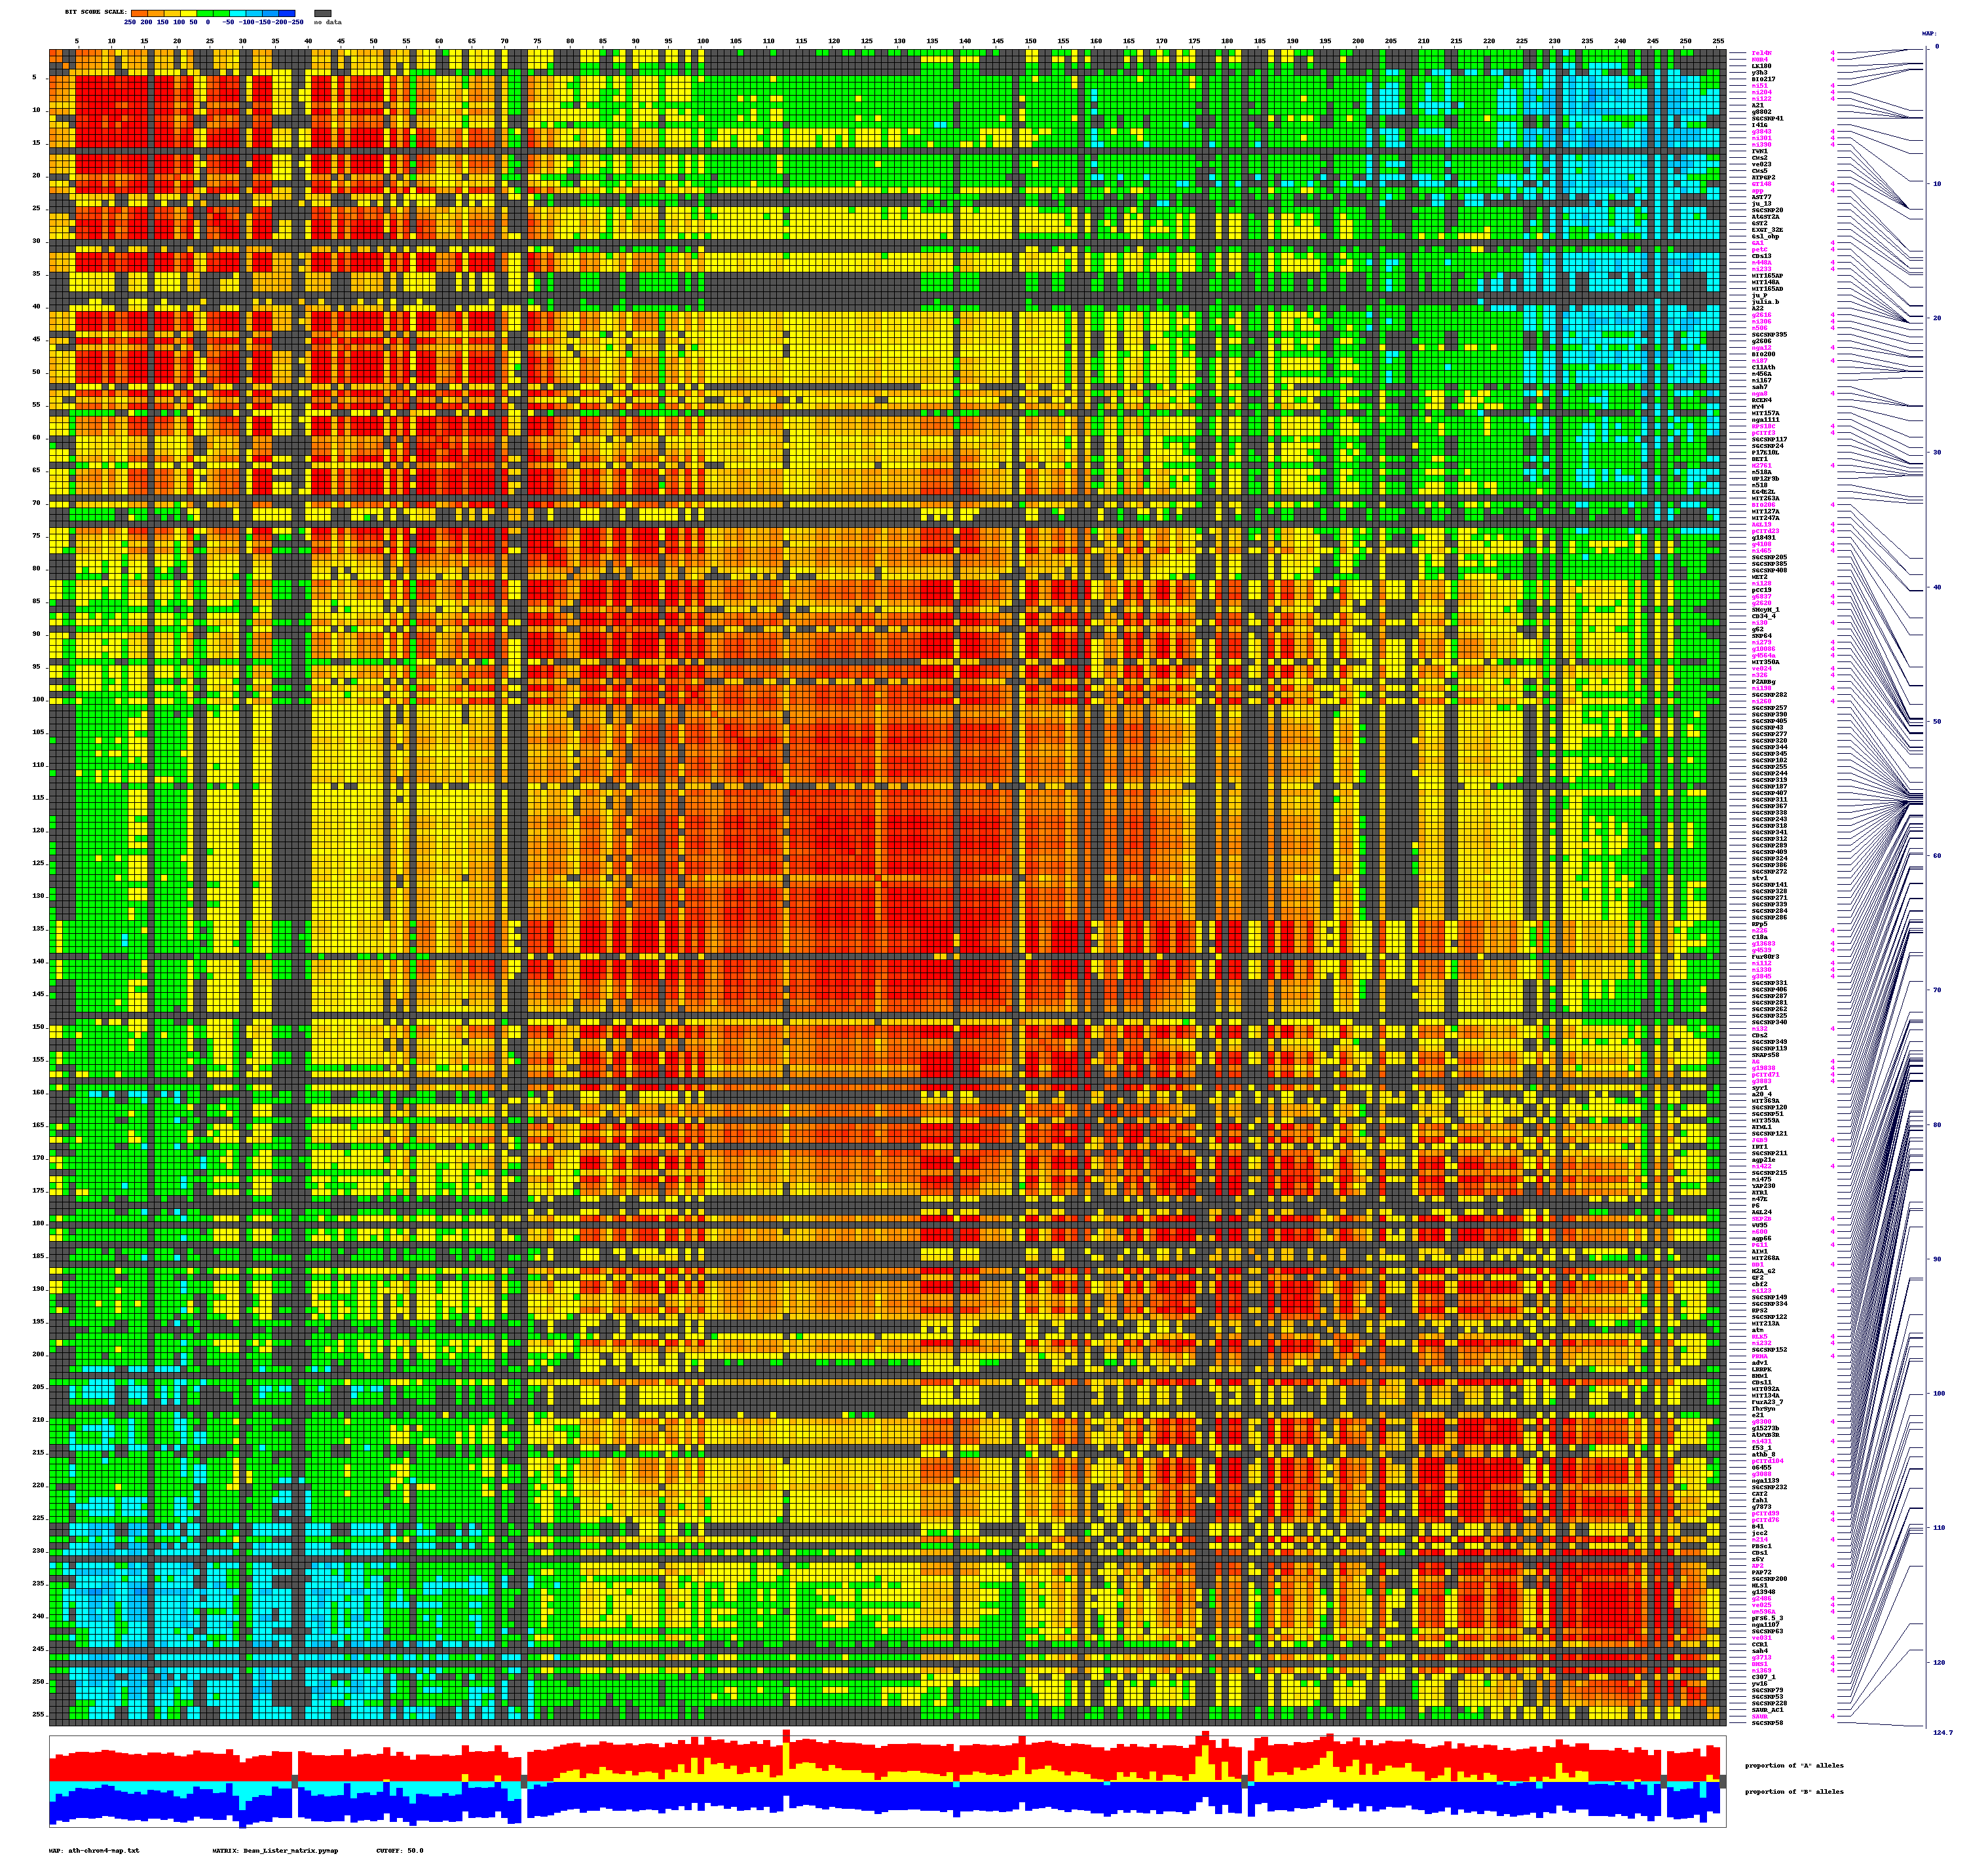
generates 2D plots of all markers versus all markers displaying recombination scores by color gradient
(read this web page for details). Two input files are required: map file and matrix file with recombination
scores. Matrix file can be generated using
Python_MadMapper_V112_RECBIT.py
script.
|
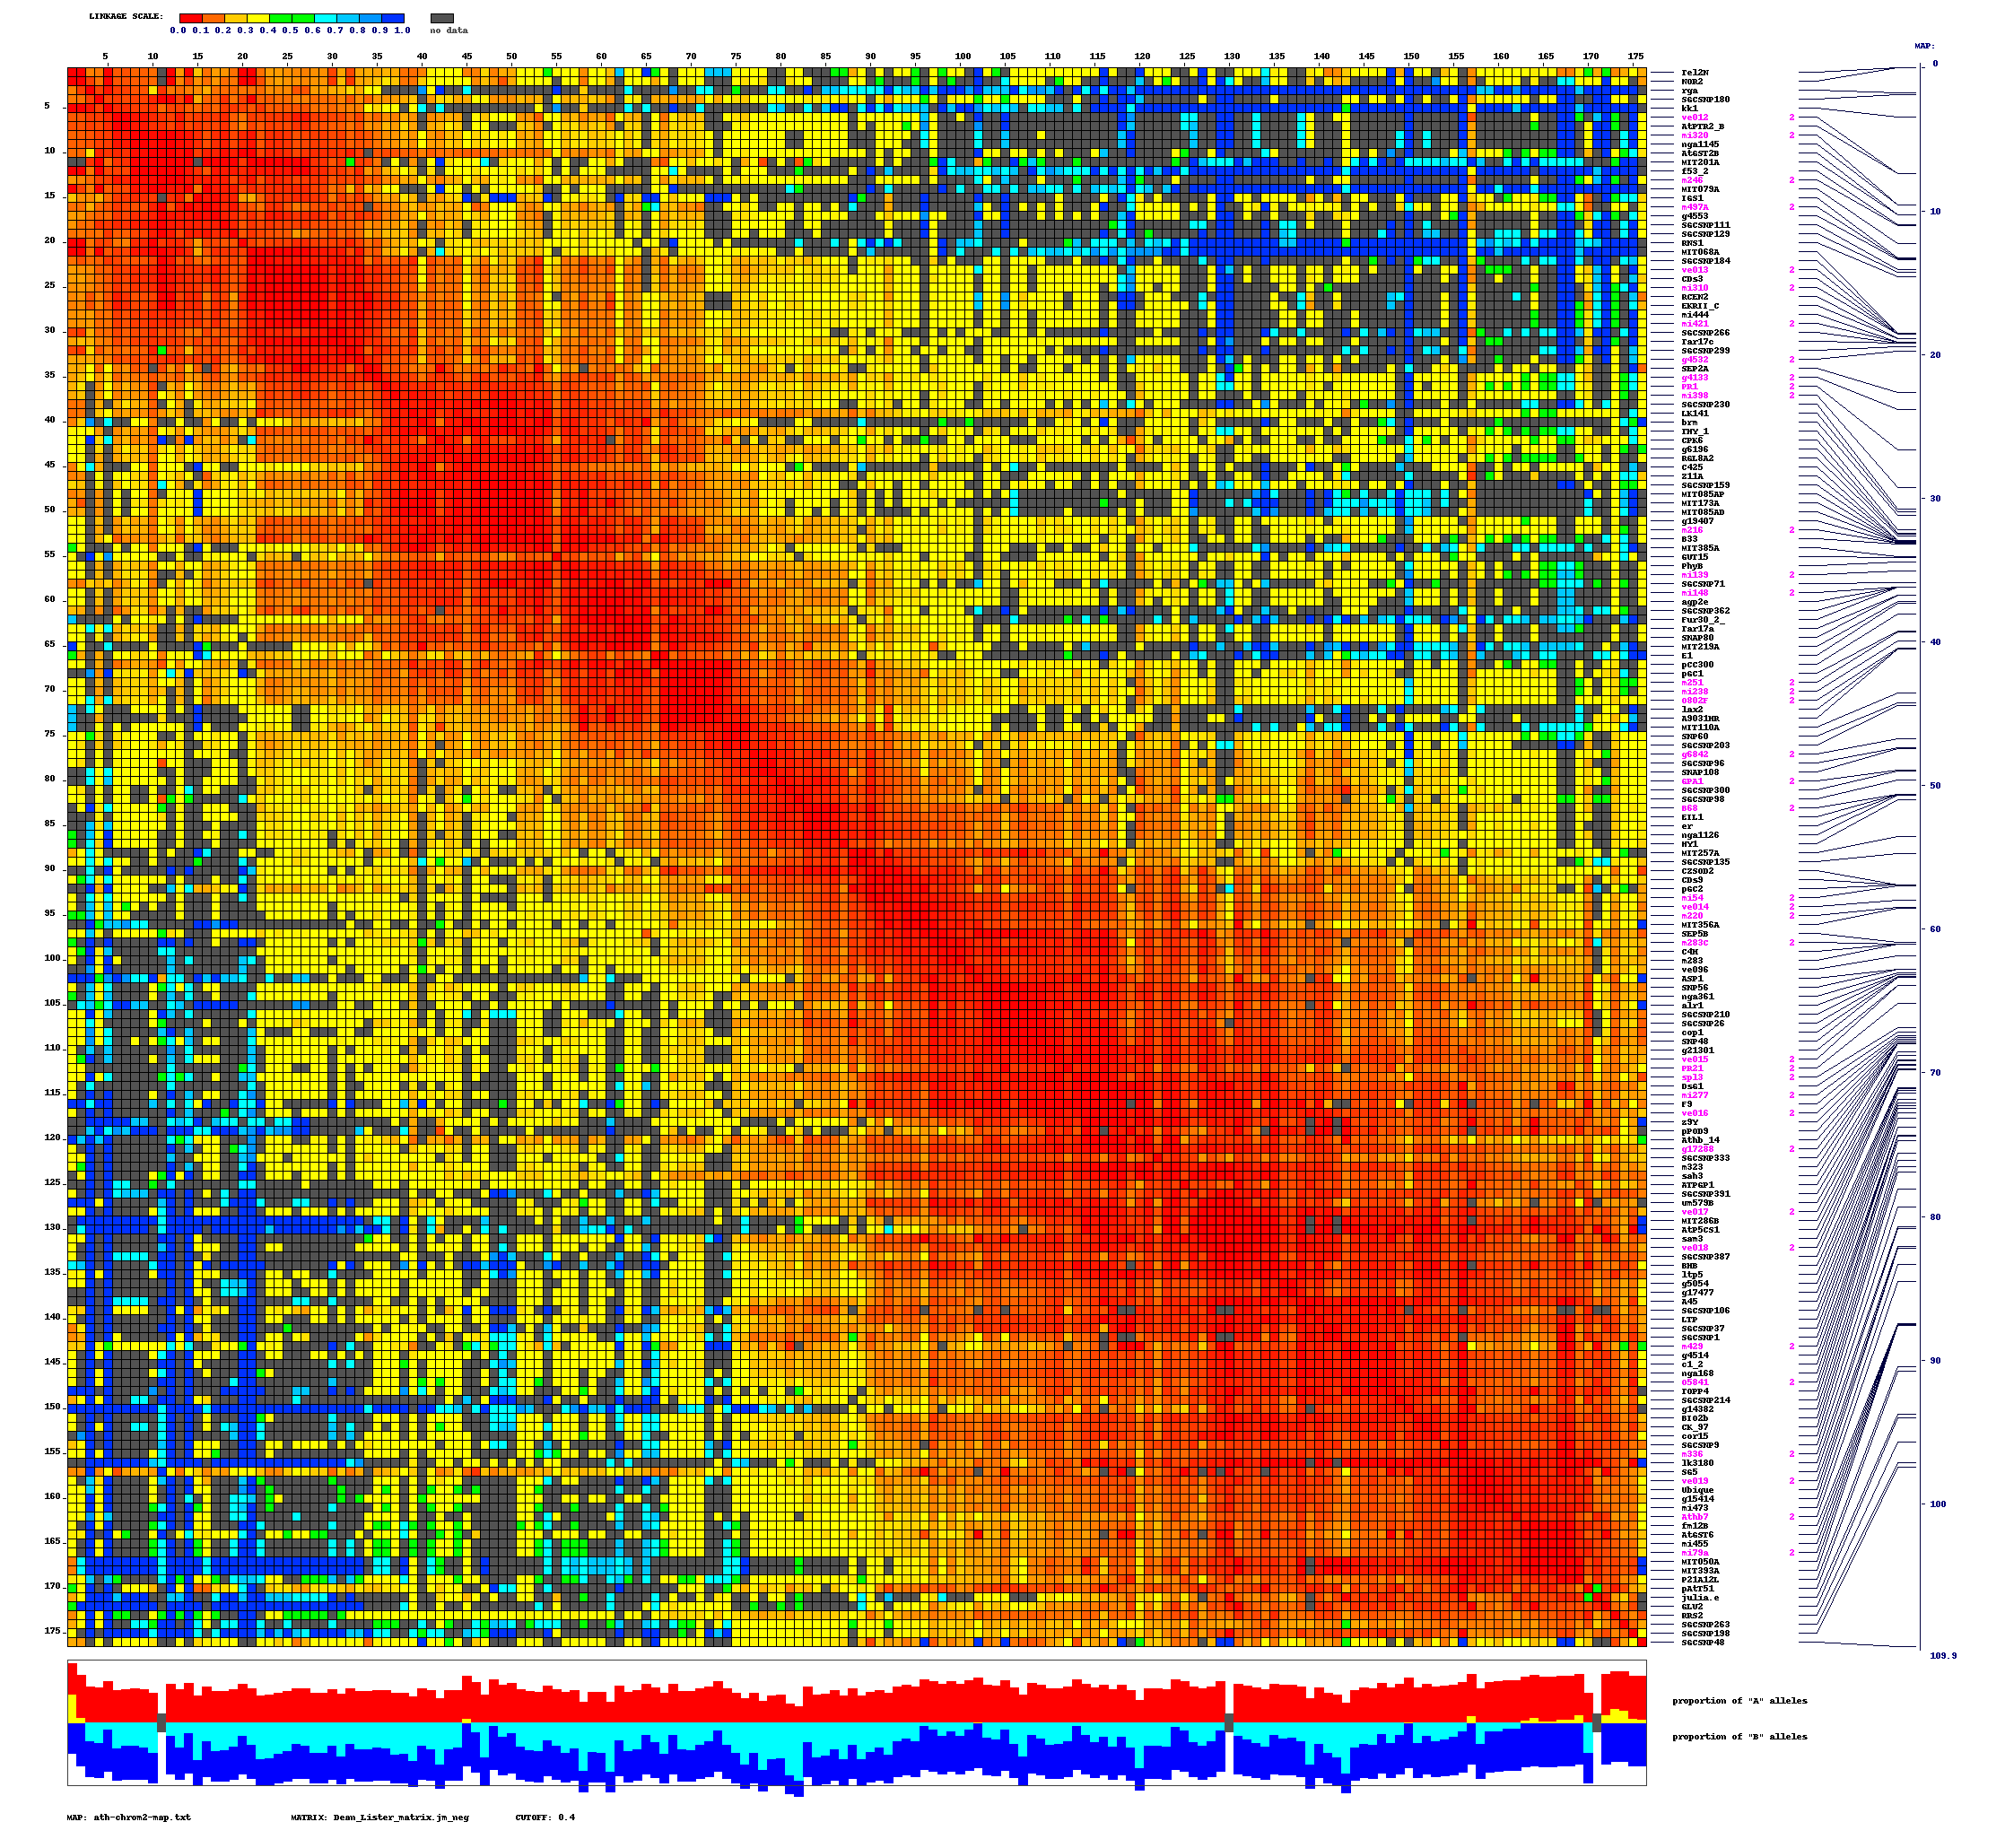
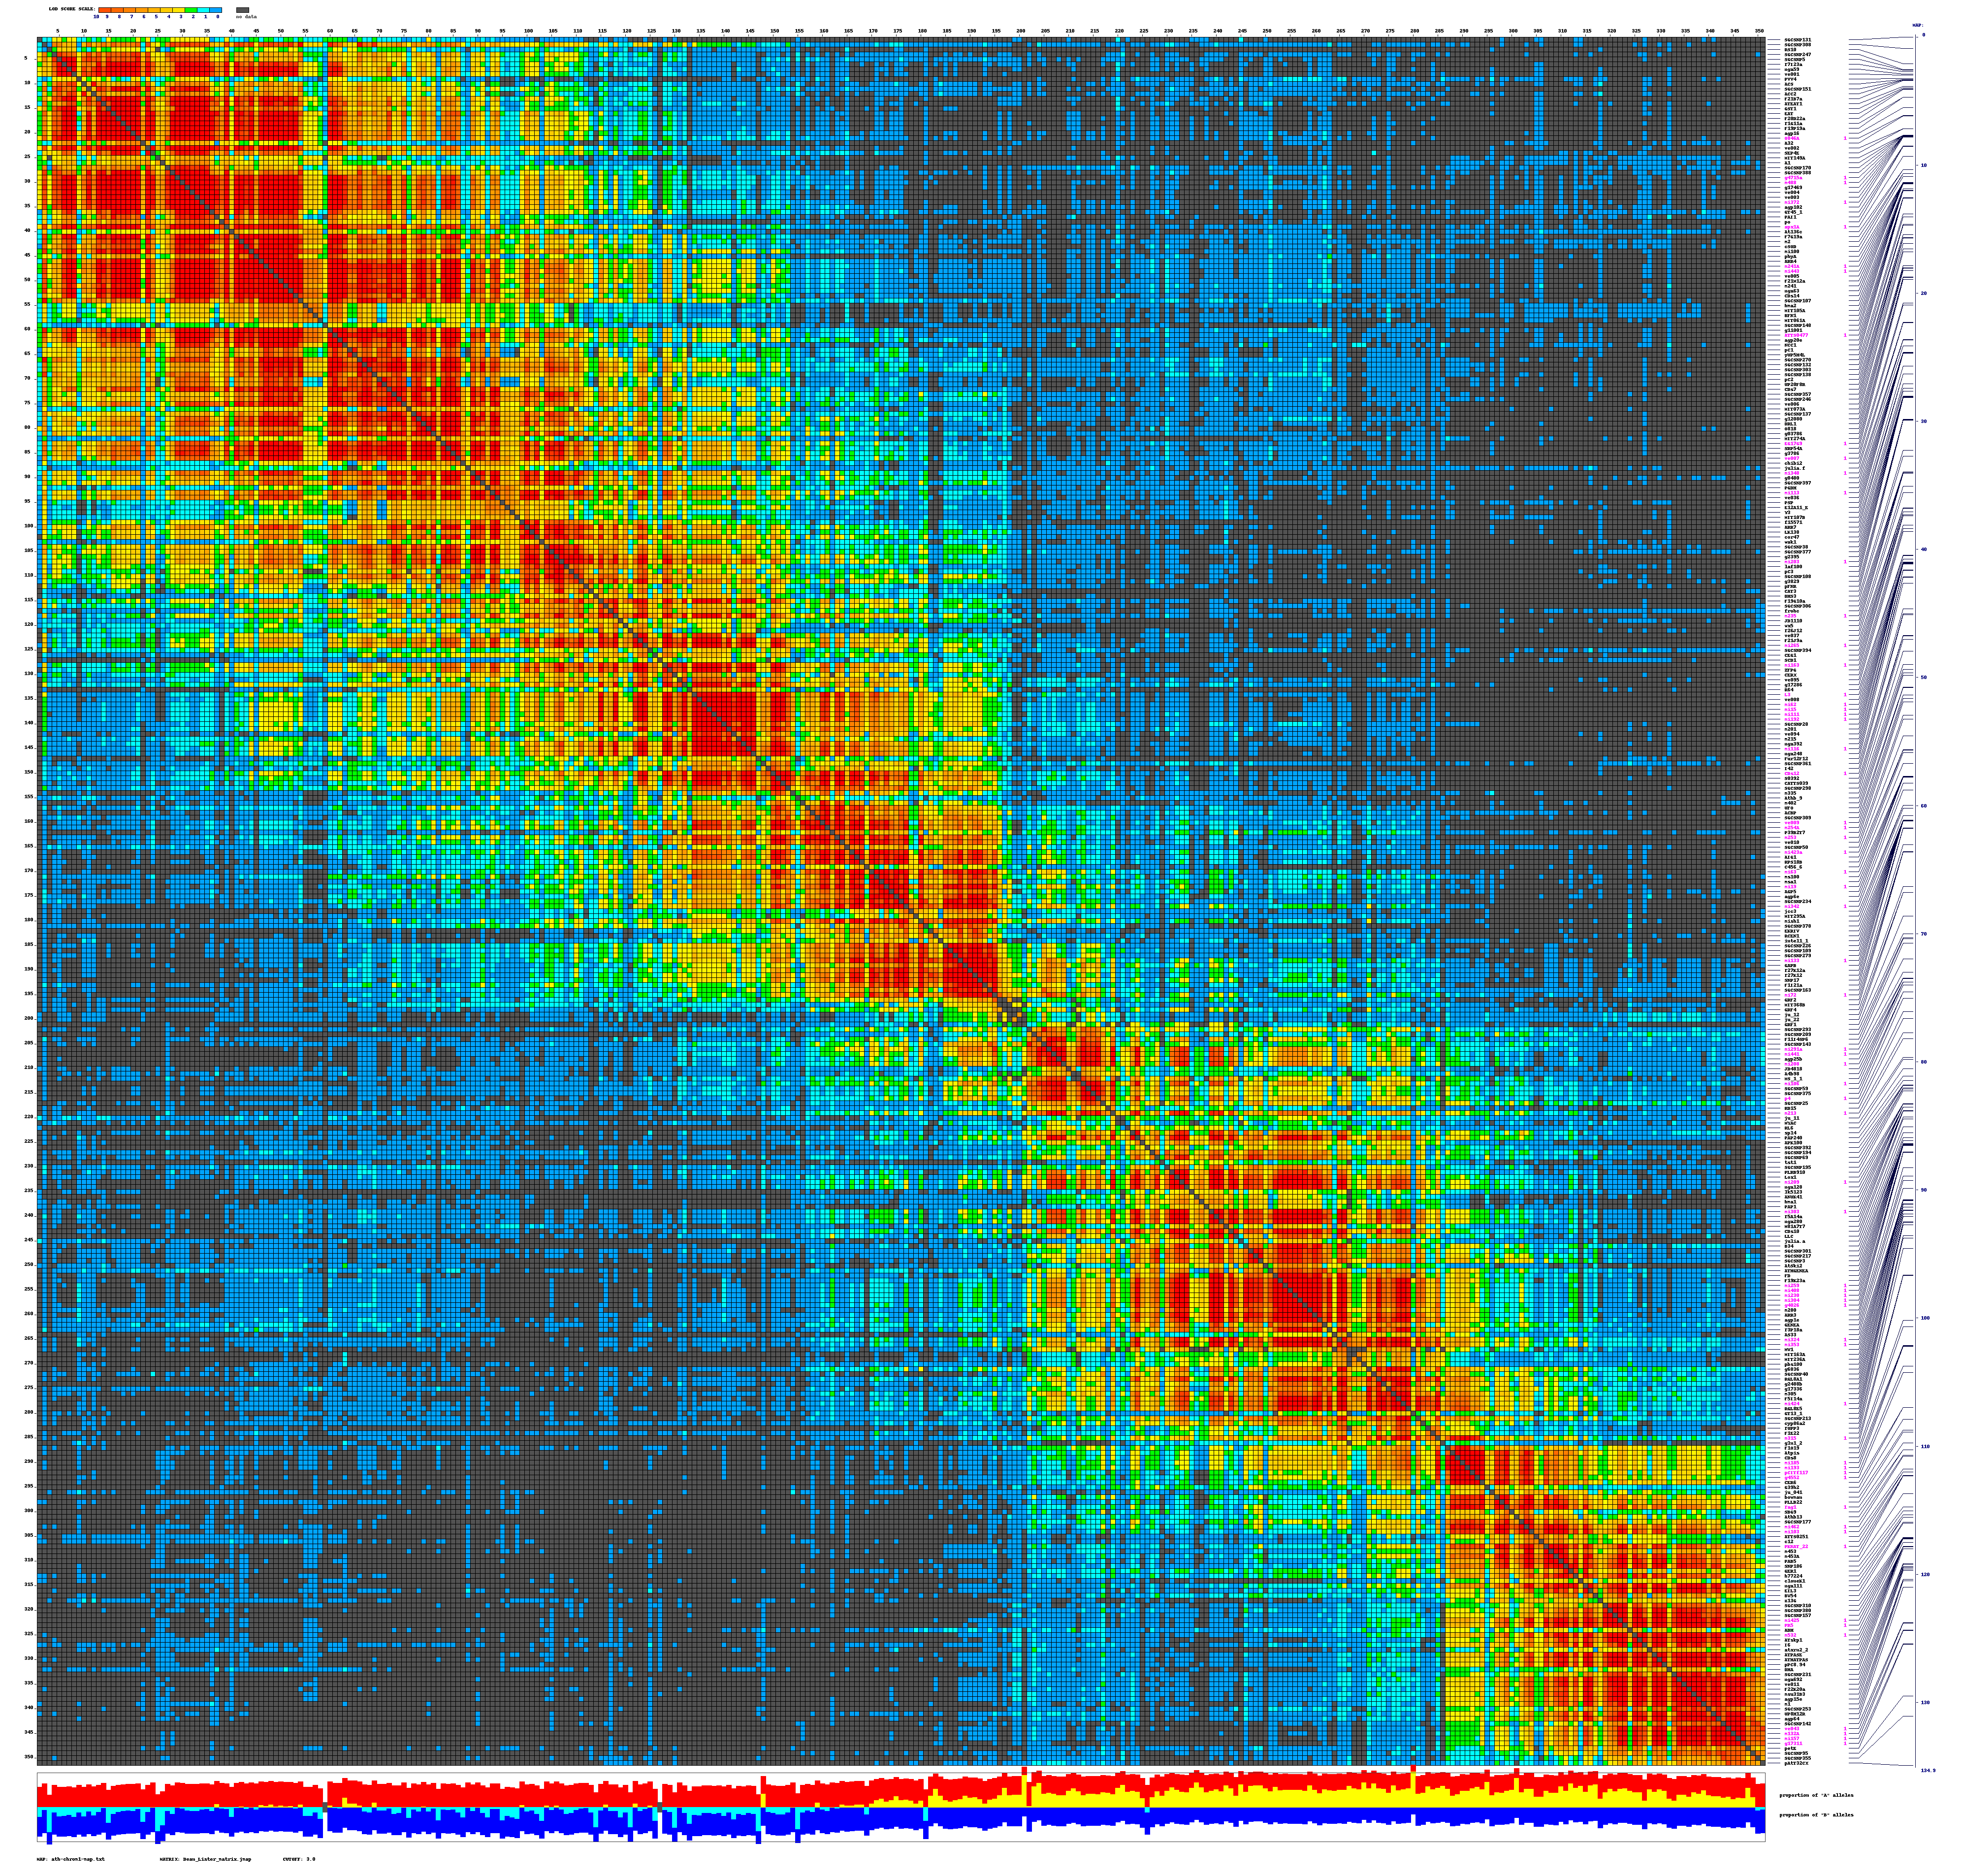
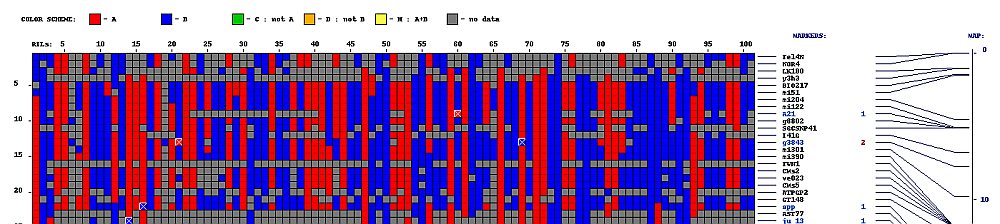
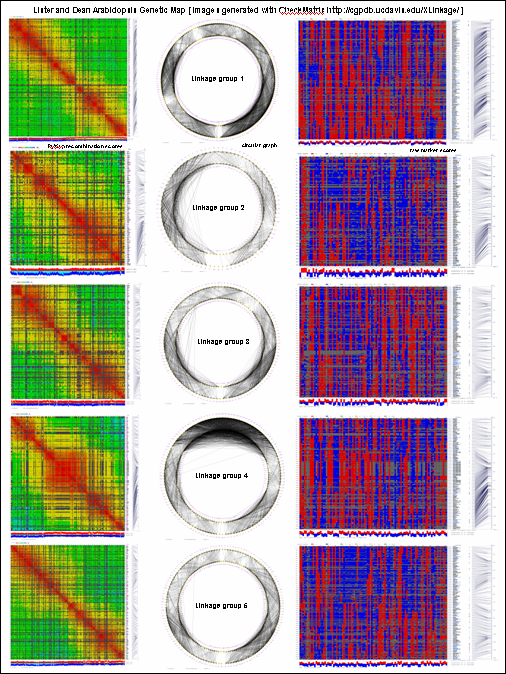
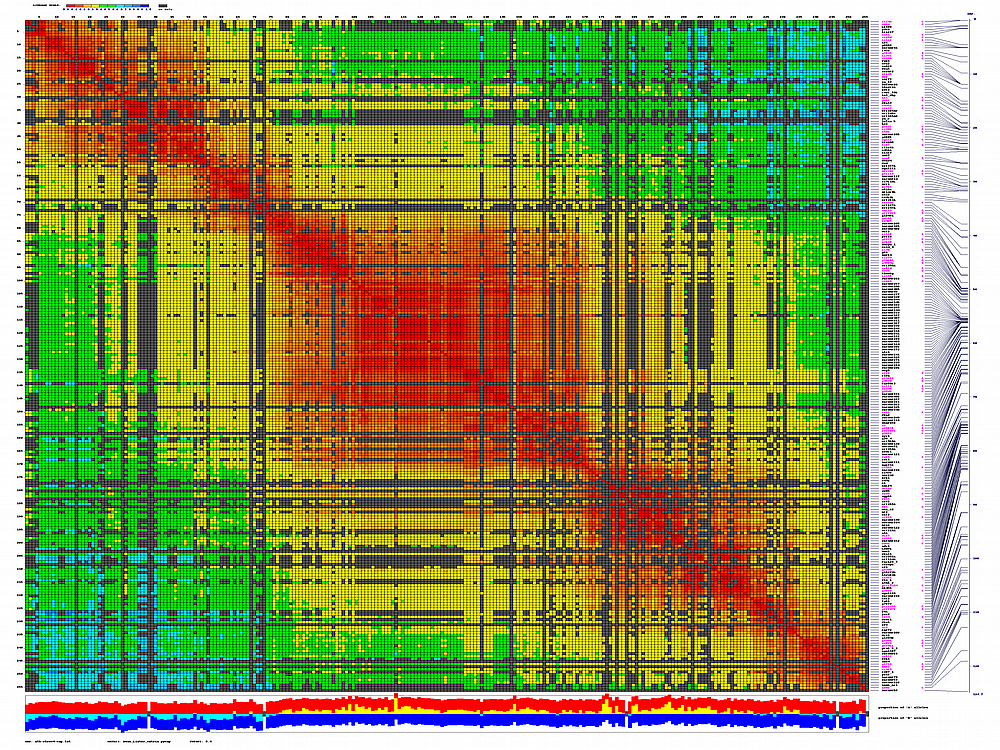
py_matrix_2D_V112_RECBIT.py was extended to generate images with
graphical genotyping. Additional file with raw marker scores is required to use this version.
Representation of genetic map in a form of circular graph was implemented here.
Read more about this version at
Genetic_Map_Raw_Scores.html web page
(of course, after reading current web page).
|
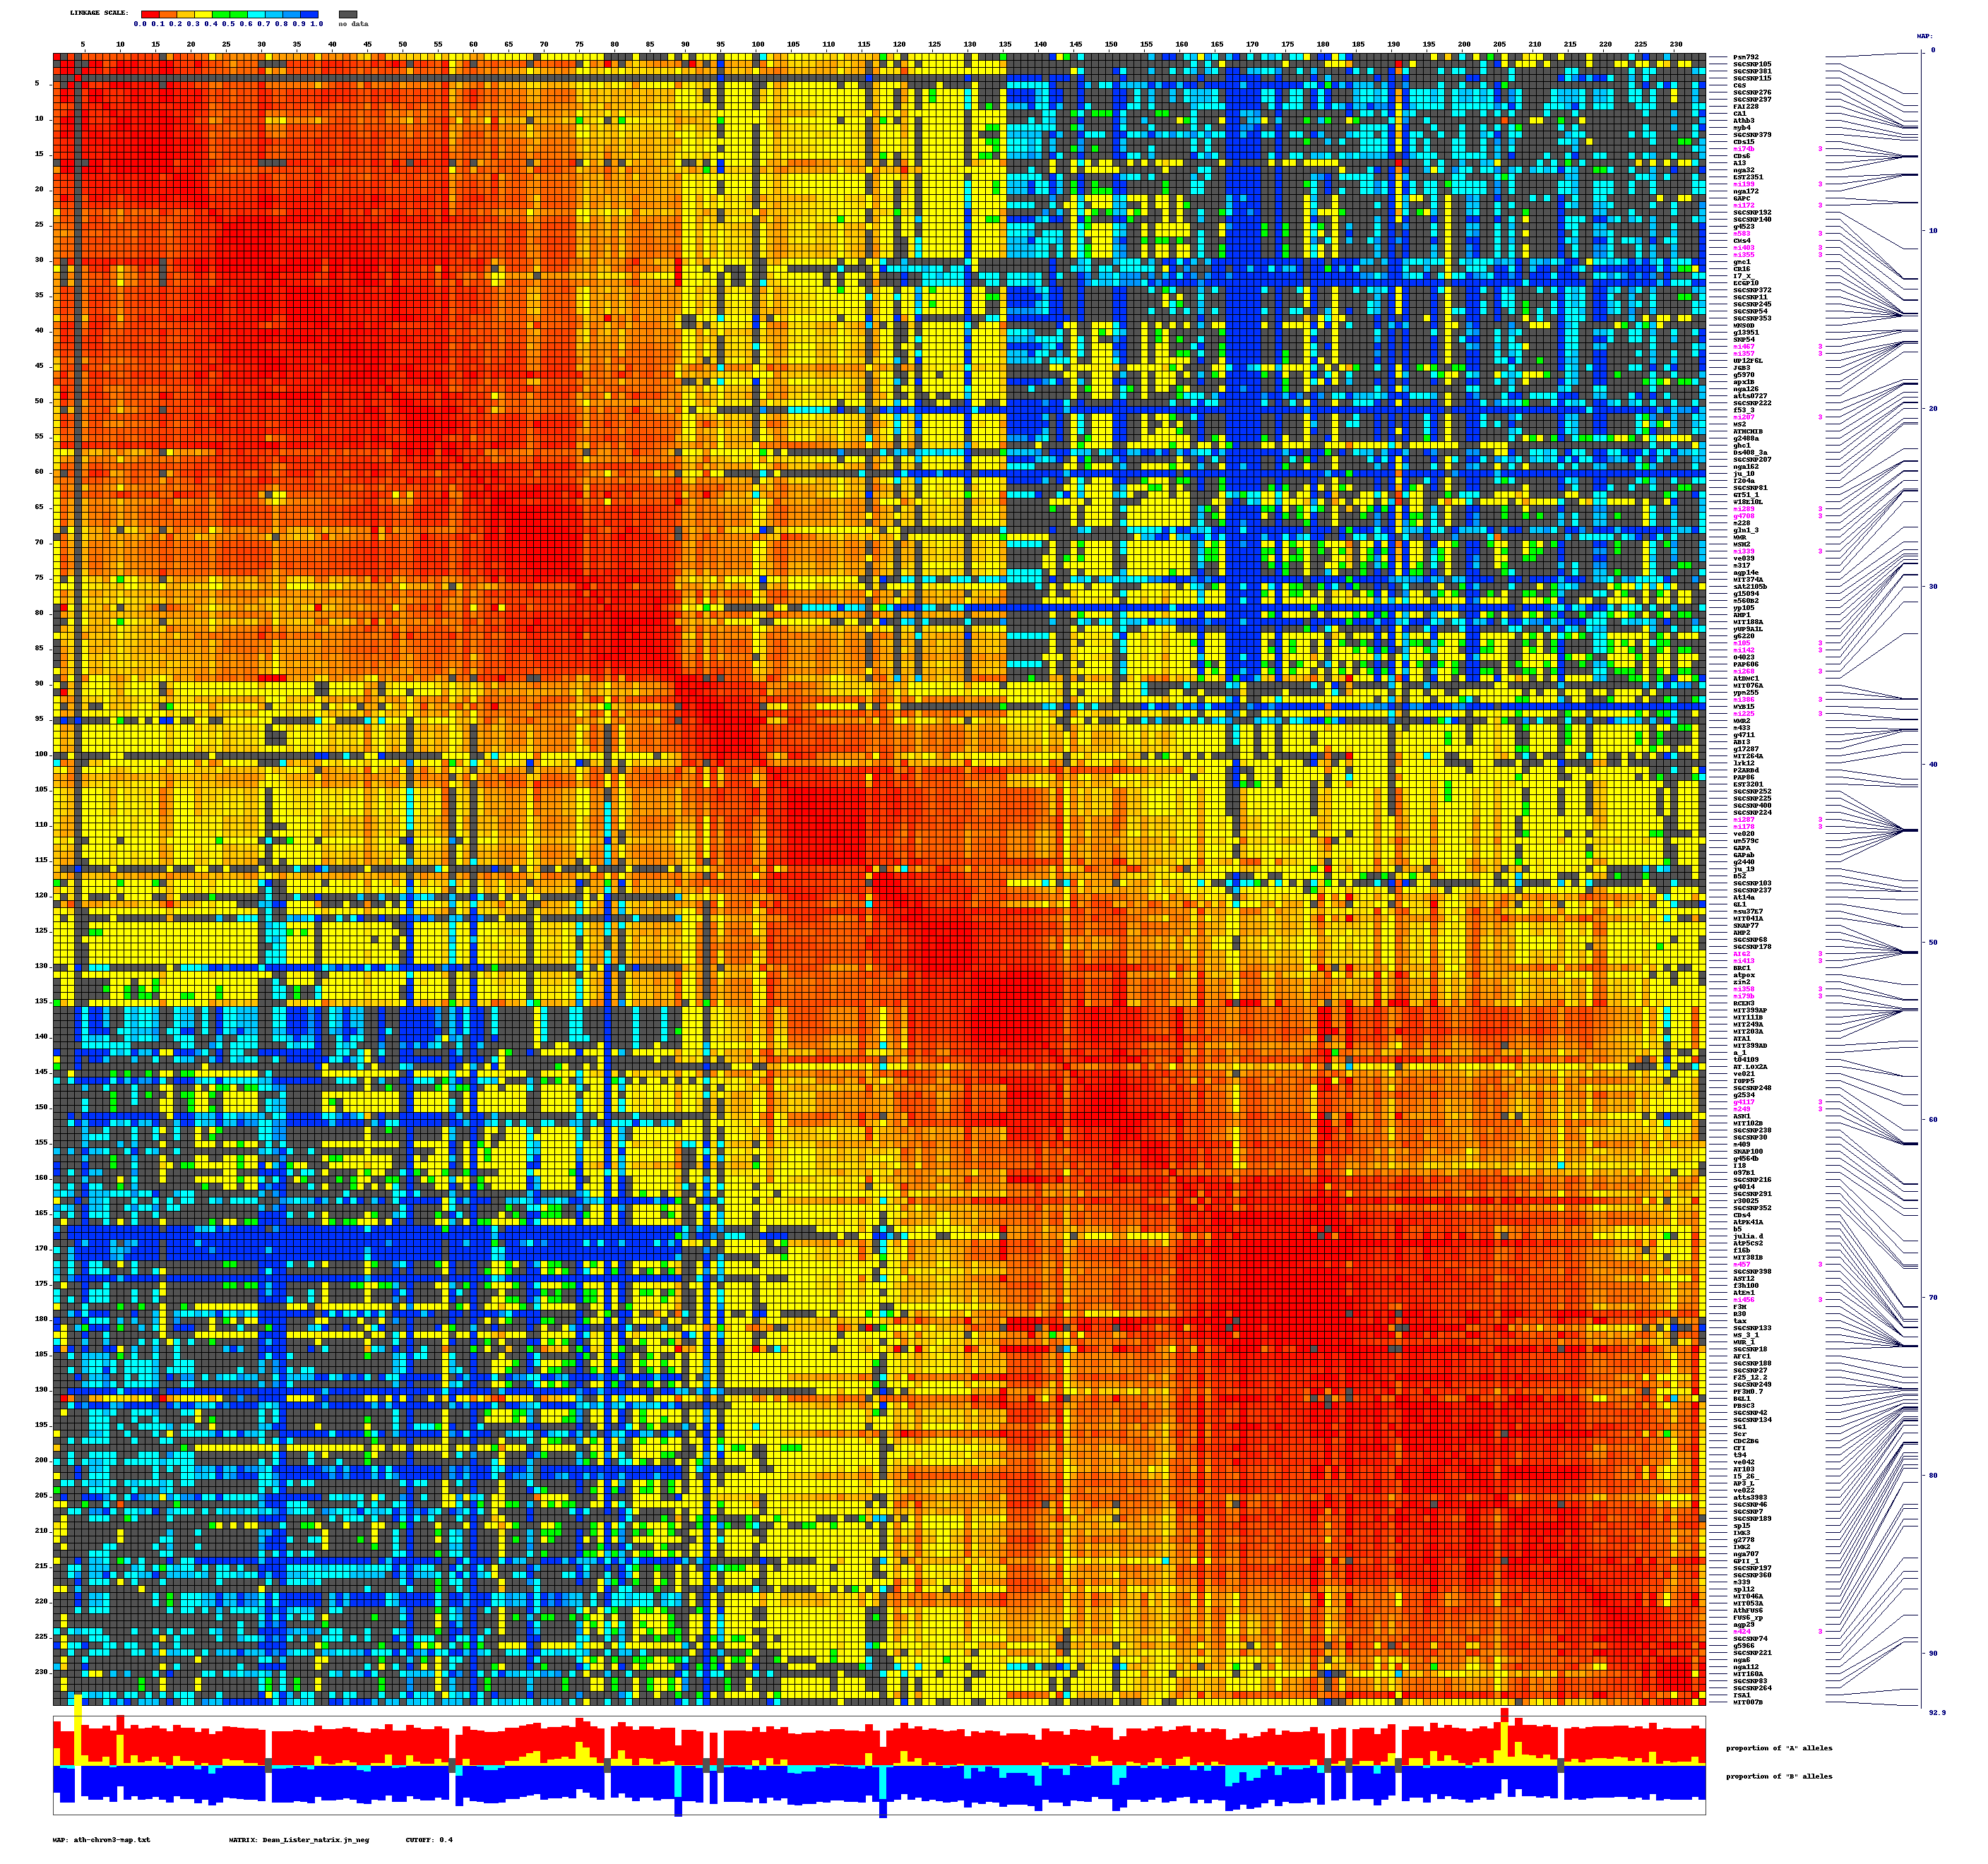
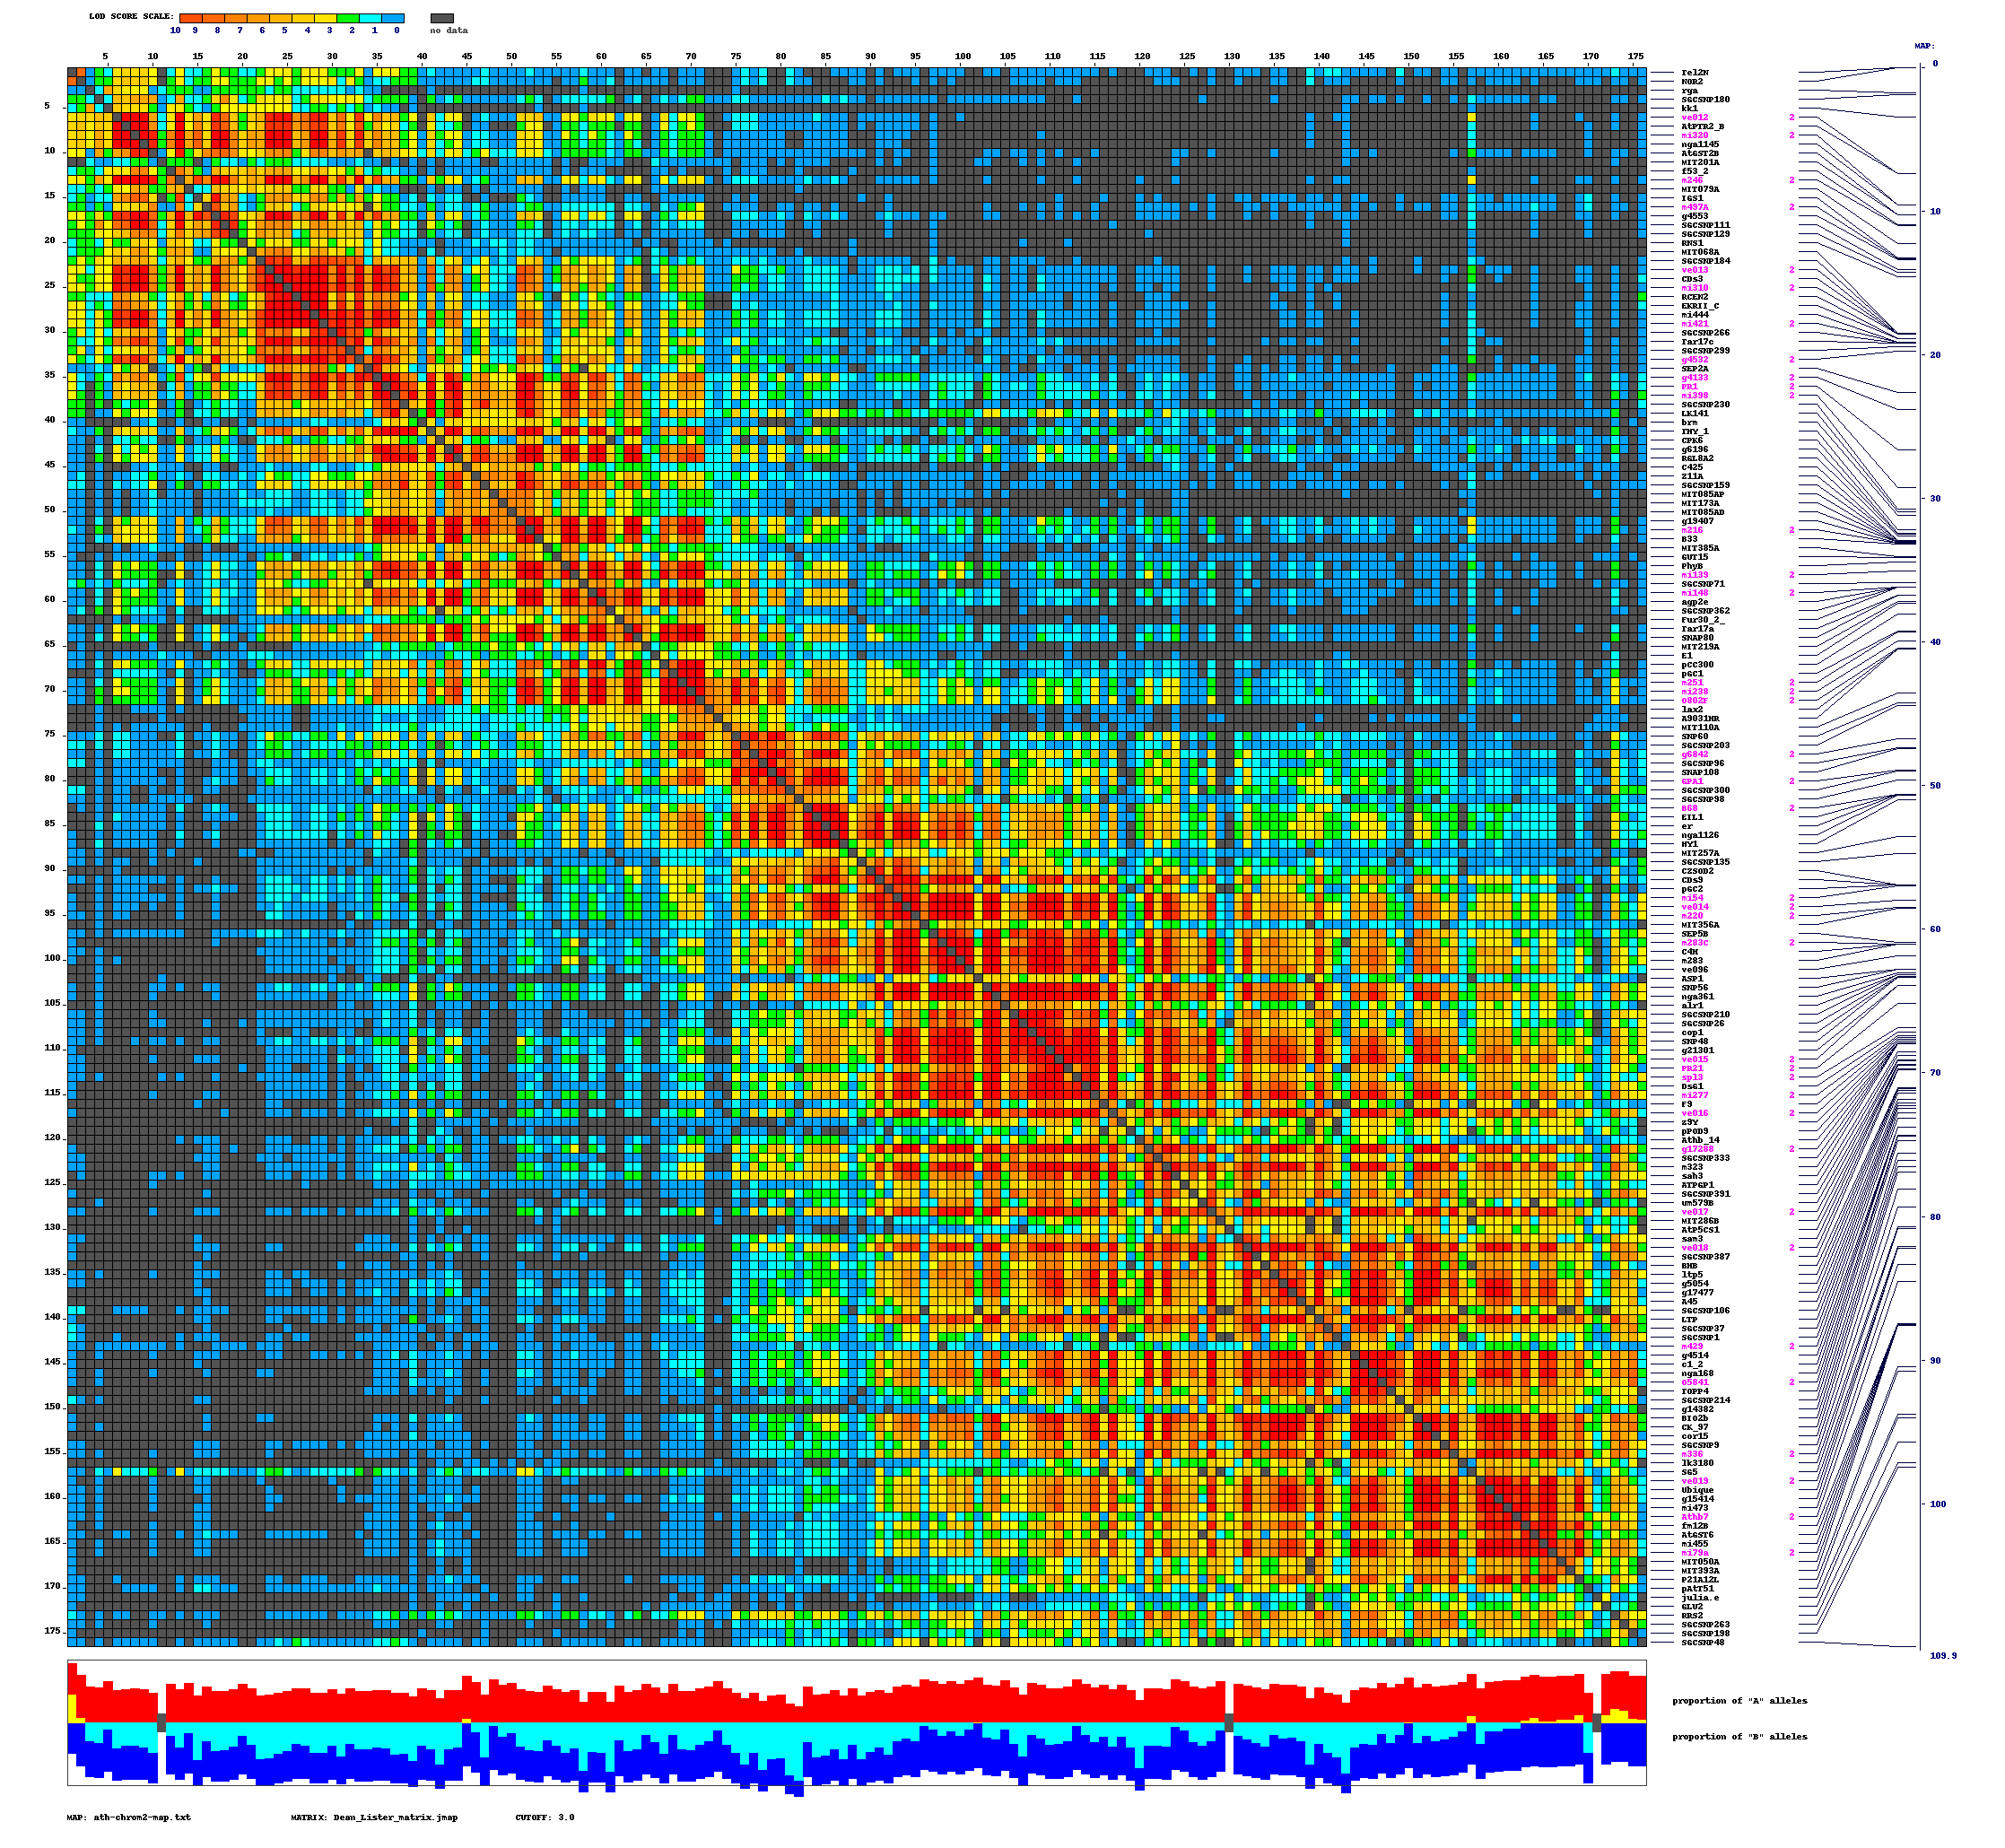
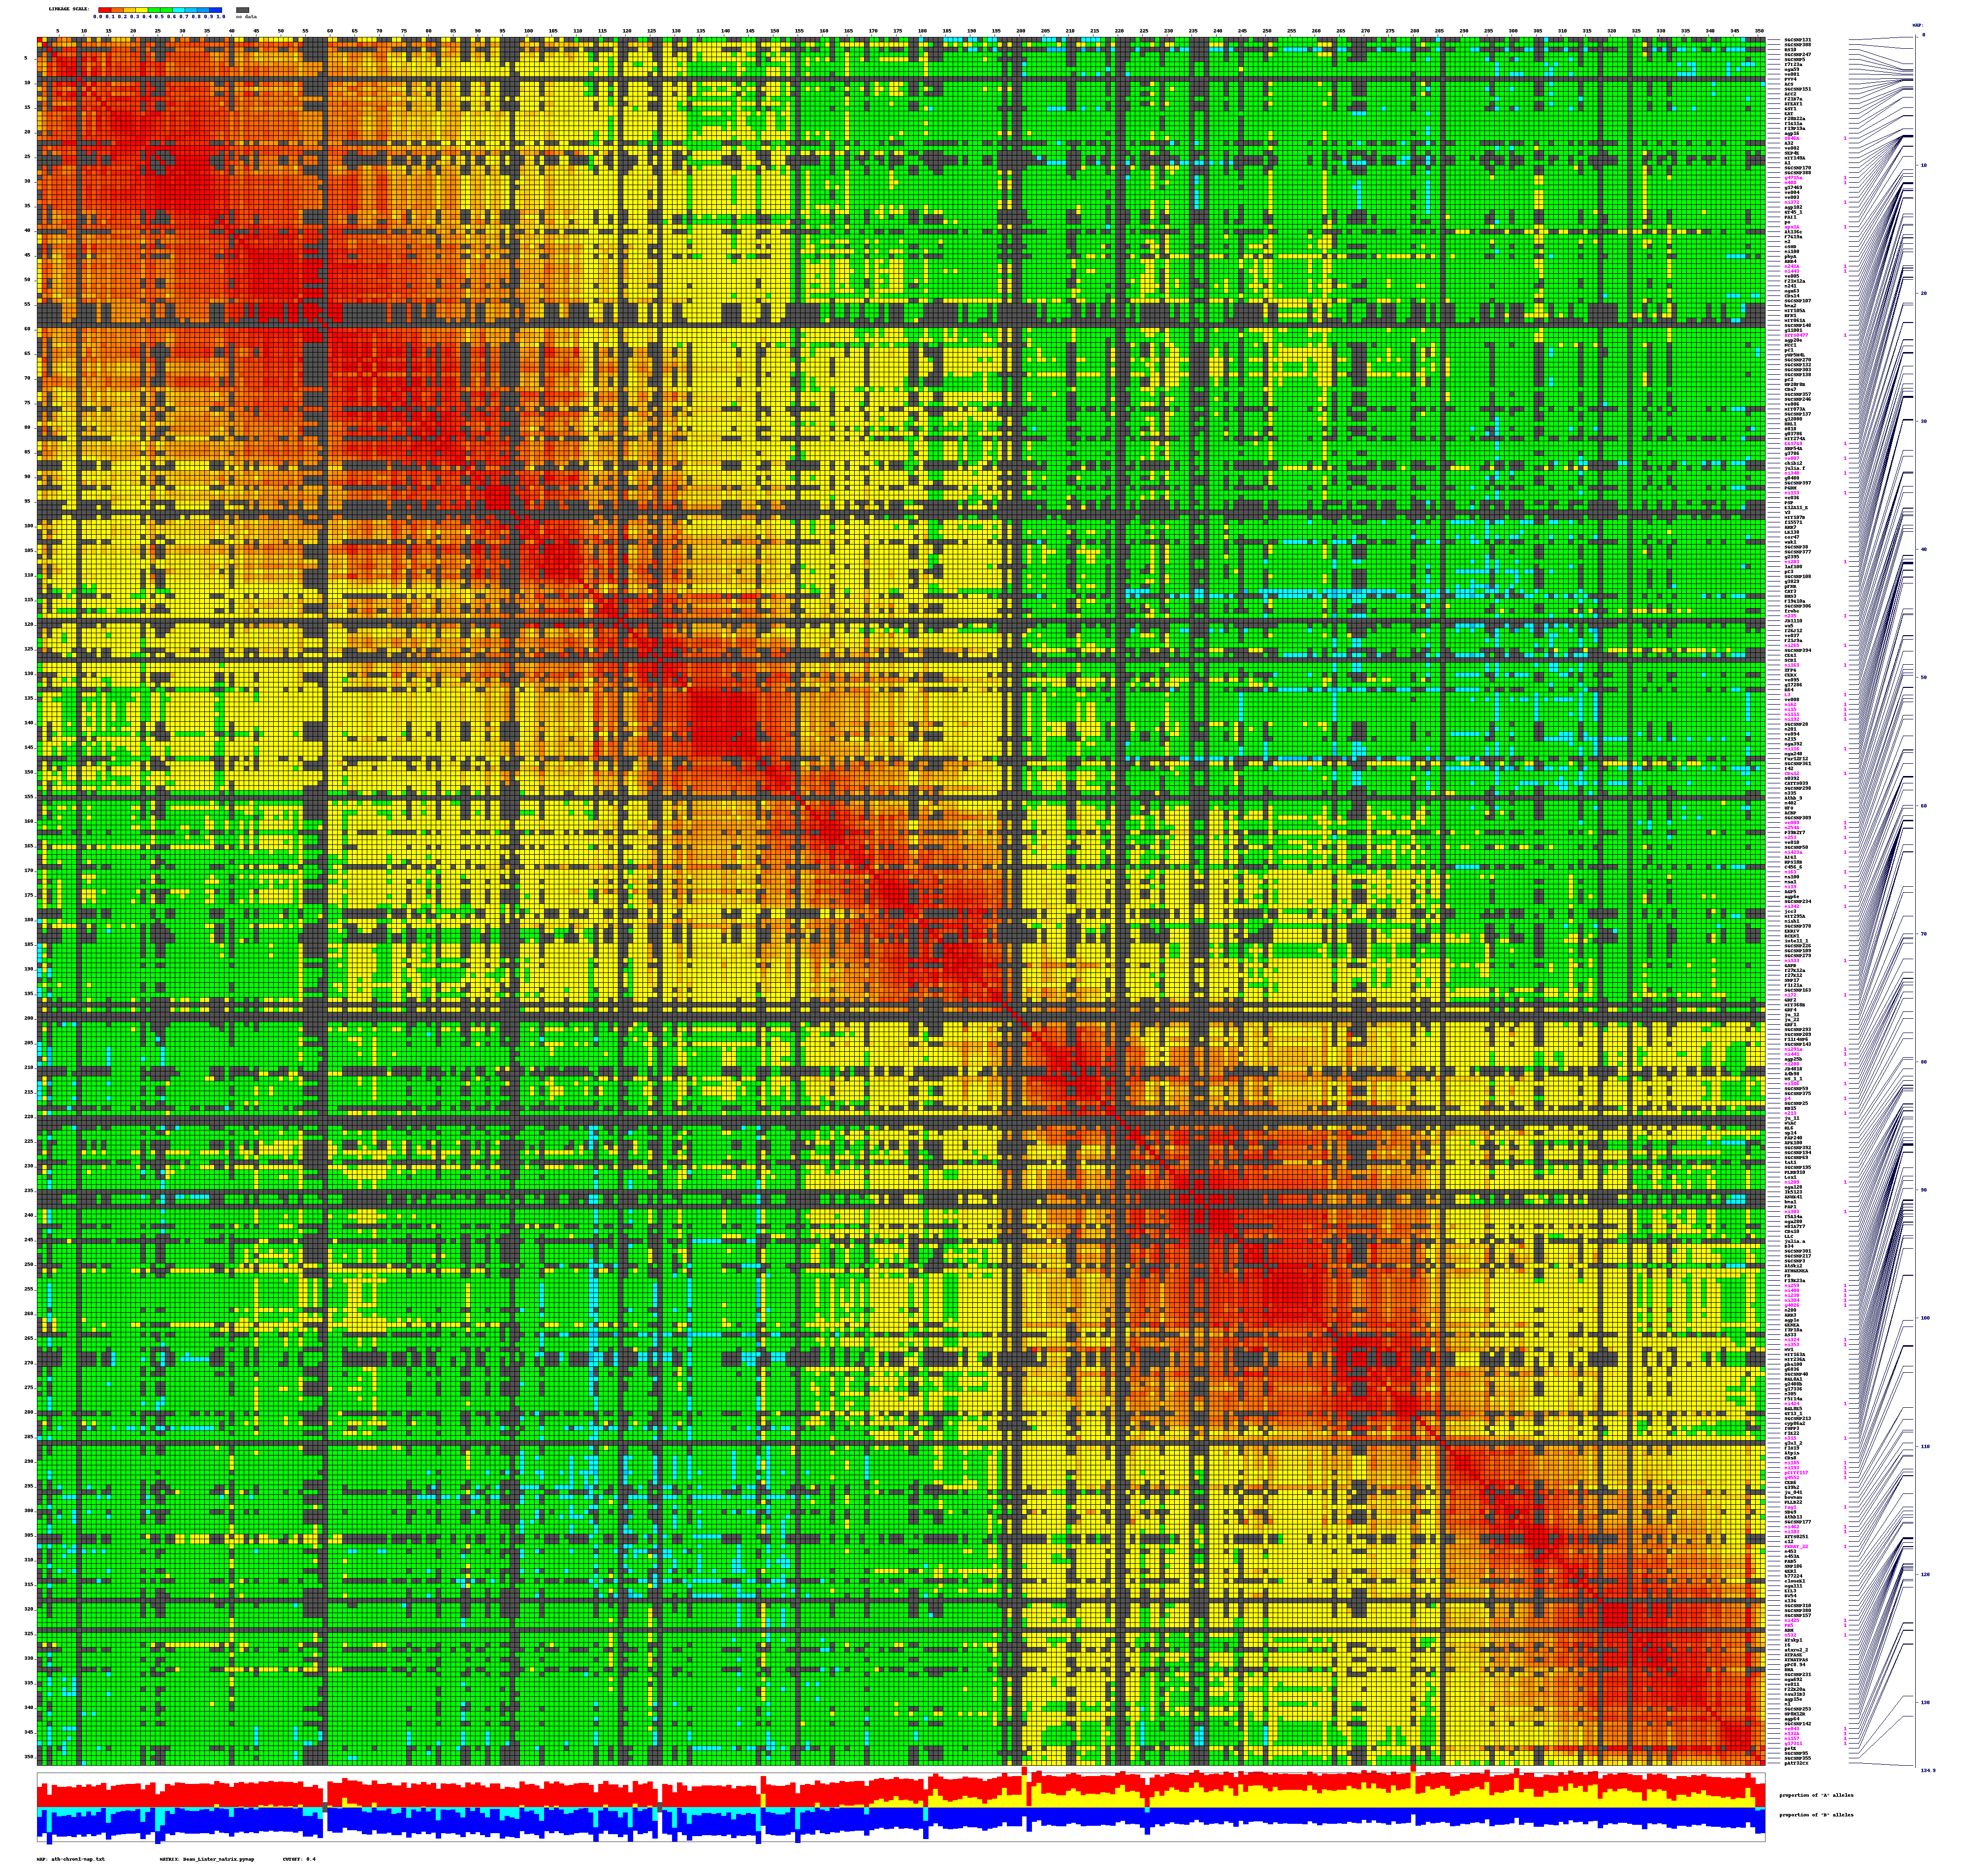
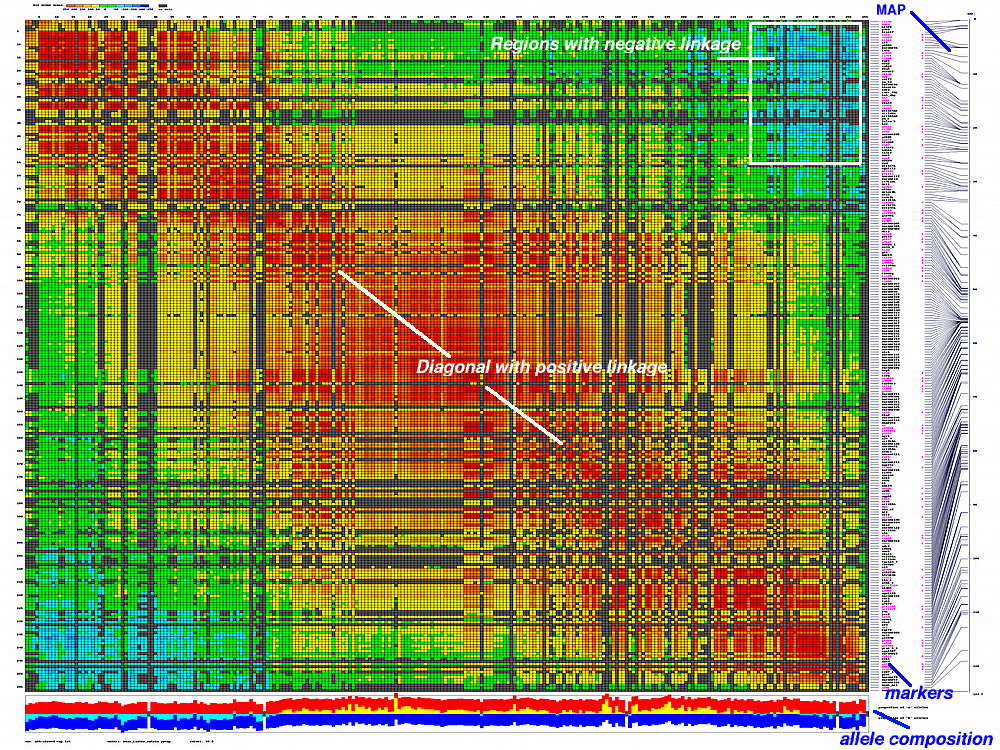
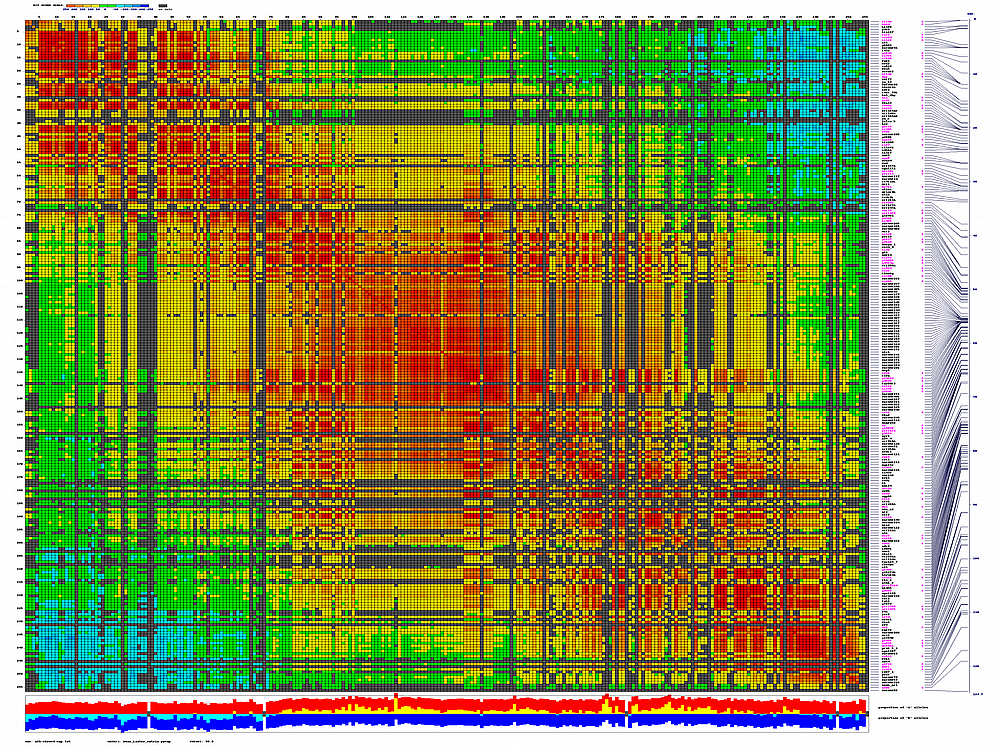
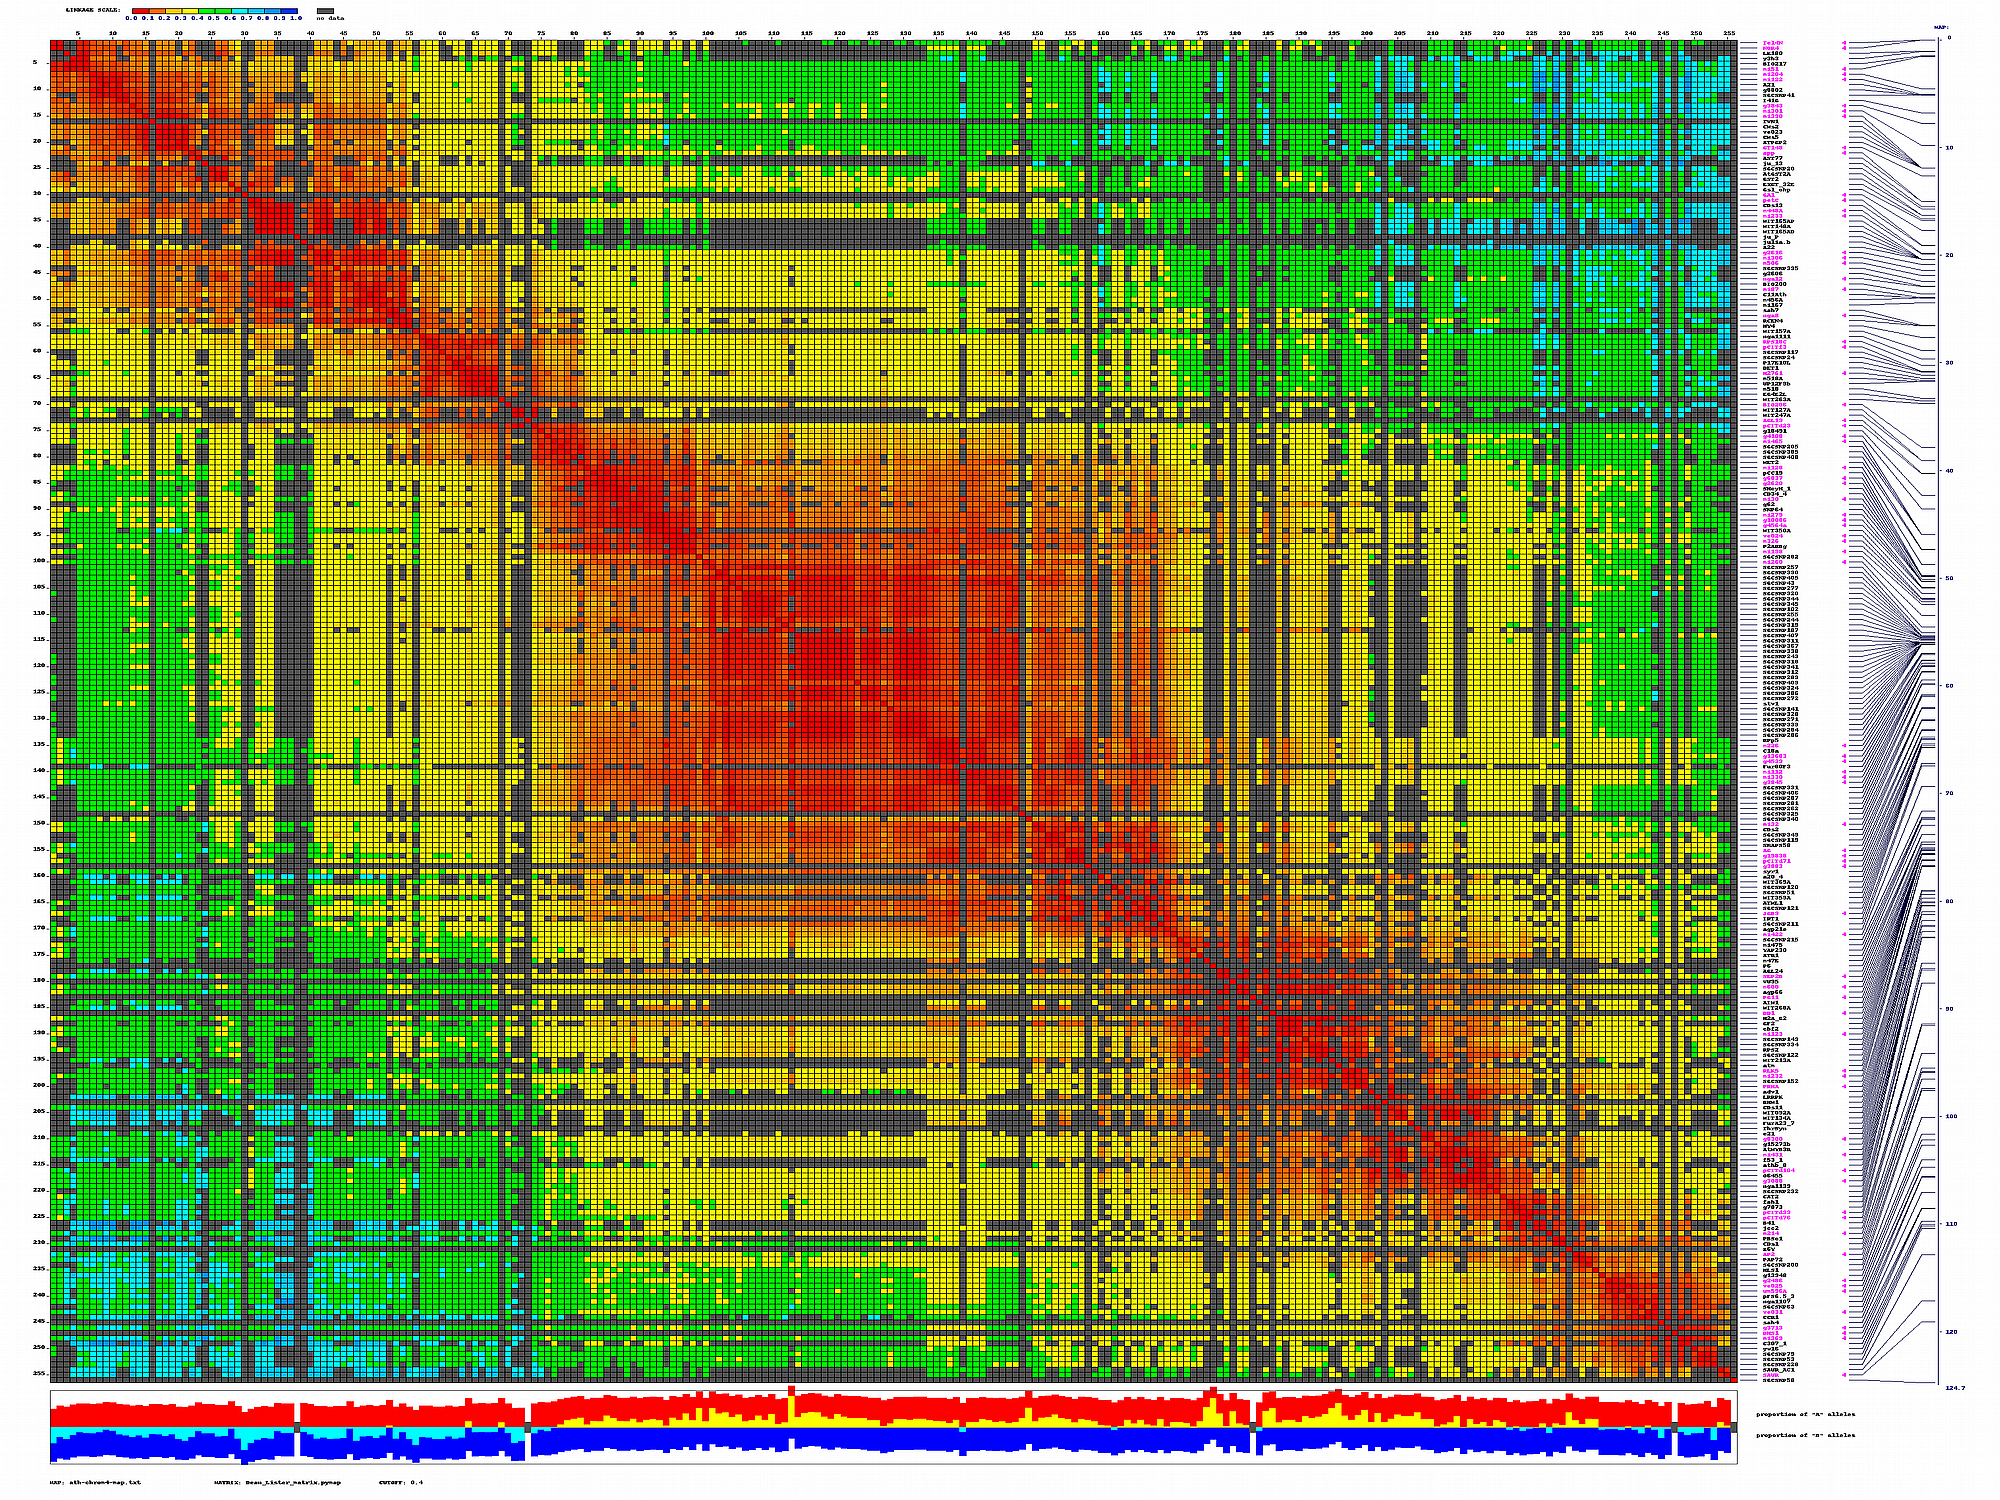
py_matrix_2D_V248_RECBIT.py has greater flexibility and functionality,
color scheme for this version was designed to enhance highlighting of the regions with negative linkage
on genetic map. Additional text output files are generated to help to validate constructed genetic maps.
Jump to Genetic_Map_Matrix_Plot_Art.html
to find details (after reading this web page).
|