Construction of high-density genetic map of Arabidopsis thaliana
using
Affymetrix microarray SFP genotyping data:
Marker grouping and inference of linear order using
MadMapper
by Alexander Kozik, UC Davis Genome Center, R.Michelmore group
in the paper:
High-density haplotyping with microarray-based expression and single feature polymorphism markers in Arabidopsis.
West MA, van Leeuwen H, Kozik A, Kliebenstein DJ, Doerge RW, St Clair DA, Michelmore RW.
Genome Res. 2006 Jun;16(6):787-95. Epub 2006 May 15.
PubMed:16702412
|
Full text article at the Genome Research
high density SFP Arabidopsis genetic map of the cross Bay-0 × Sha containing 637 markers was constructed using JoinMap program.
On this web page we demonstrate alternative approach to construct genetic map using
MadMapper suite only.
Scripts:
Python_MadMapper_V248_RECBIT_012NR.py
Python_MadMapper_V248_XDELTA_115.py
py_matrix_2D_V248_RECBIT.py -
CheckMatrix
Original data source (genotyping data):
elp.ucdavis.edu
File with raw marker scores
SFPmap_1258_markers.txt
has been slightly modified by adding random numbers in front of IDs to eliminate possible bias because of sorting by mapping program.
original file can be accessed locally here:
Ath_SFP_Scores_1258.loc
and modified version with random prefixes here:
Ath_SFP_Scores_1258_Rand.loc
STEP 1: GENERATION OF NON-REDUNDANT SET OF SCORES
python Python_MadMapper_V248_RECBIT_012NR.py Ath_SFP_Scores_1258_Rand.loc Ath_SFP_Scores_1258_Rand.recbit01 0.2 100 25 X 0.33 50 NR_SET 3
file with non-redundant marker scores are generated upon script execution:
Ath_SFP_Scores_1258_Rand.recbit01.z_nr_scores.loc
Ath_SFP_Scores_1258_Rand.recbit01.z_nr_scores.loc is re-named into
Ath_SFP_Scores_0846_Rand.loc
since it contains 846 markers with non-redundant scores.
STEP 2: MARKER CLUSTERING/GROUPING AND FINDING OF DISTINCT LINKAGE GROUPS
python Python_MadMapper_V248_RECBIT_012NR.py Ath_SFP_Scores_0846_Rand.loc Ath_SFP_Scores_0846_Rand.recbit02 0.2 100 120 X 0.33 14 TRIO 3
eighty two (82) files are generated; we are interested in two files:
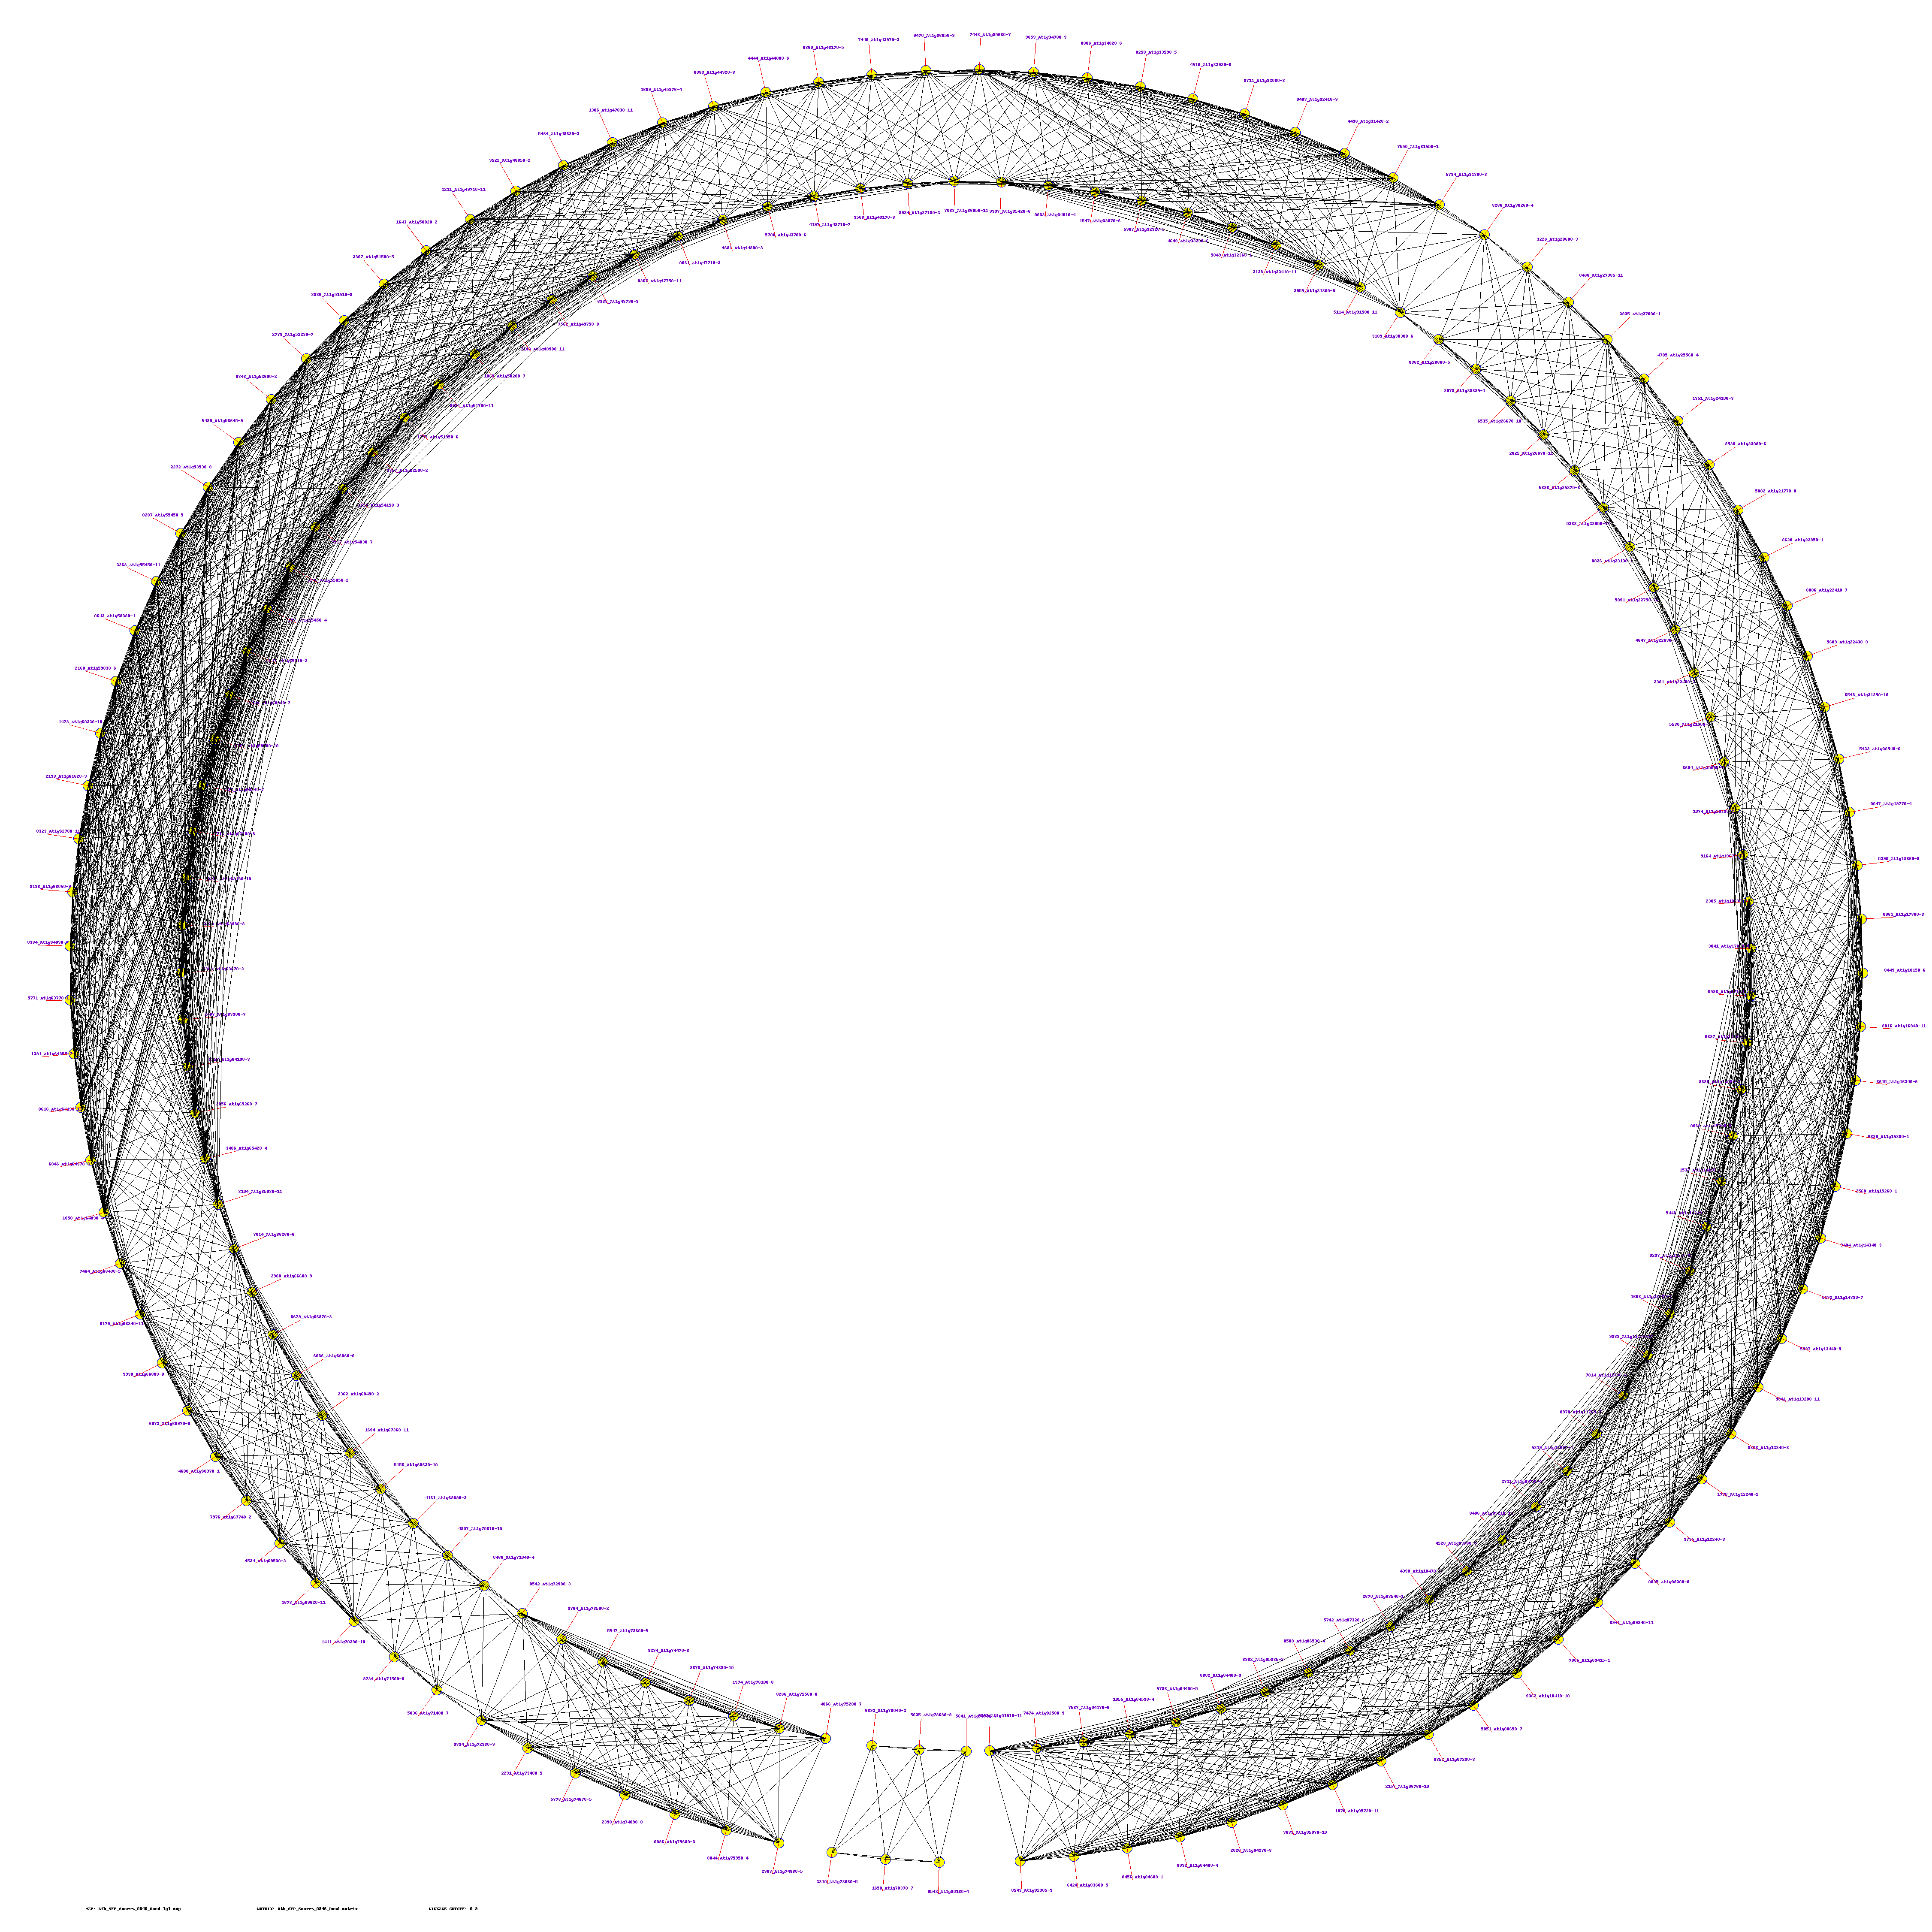
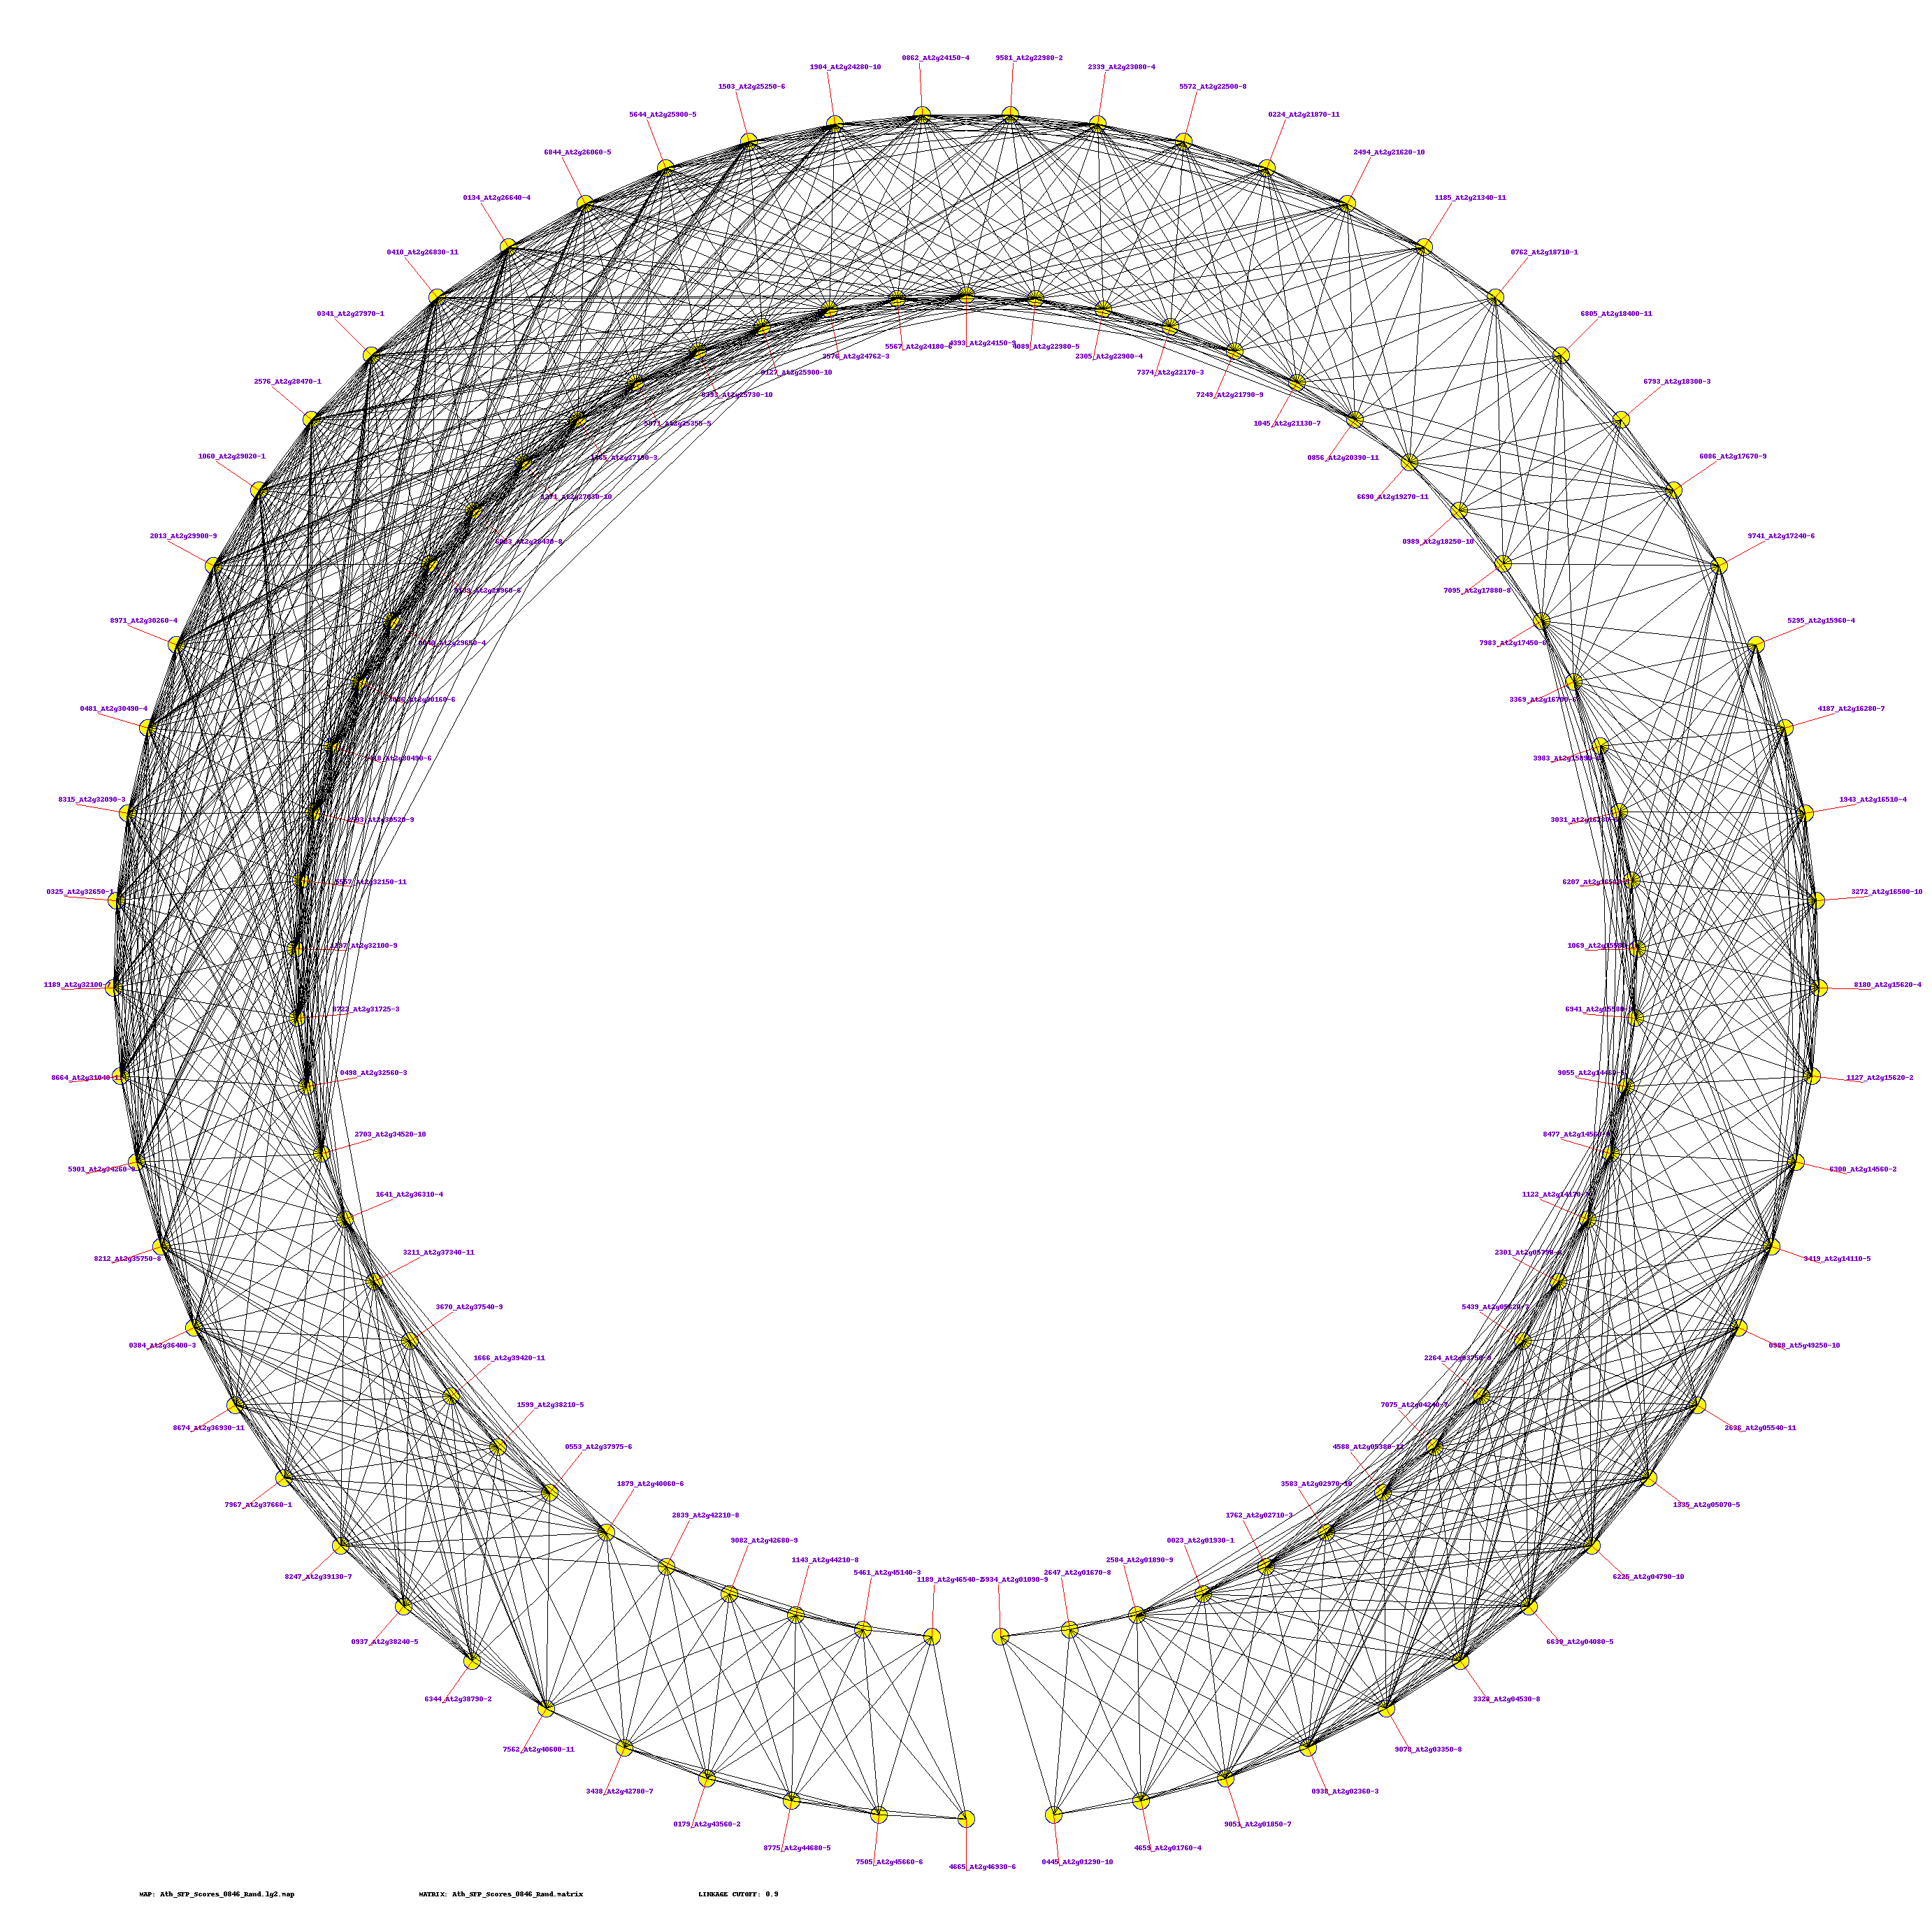
Ath_SFP_Scores_0846_Rand.recbit02.pairs_all -
pairwise distances for all pair of markers
Ath_SFP_Scores_0846_Rand.recbit02.x_tree_clust is re-named into
Ath_SFP_Scores_0846_Rand.matrix
because it will be used by ChekMatrix and MadMapper_XDELTA programs as matrix file
Ath_SFP_Scores_0846_Rand.recbit02.x_tree_clust -
clustering/grouping of markers into distinct linkage groups
Ath_SFP_Scores_0846_Rand.recbit02.x_tree_clust.xls -
MS Excel version of the file above
STEP 3: ANALYSIS OF GROUP INFO FILE, SELECTION OF DISTINCT LINKAGE GROUPS AND FRAMEWORK MARKERS
Ath_SFP_Scores_0846_Rand.recbit02.x_tree_clust.xls
was analyzed and five group files were generated for visualization with CheckMatrix:
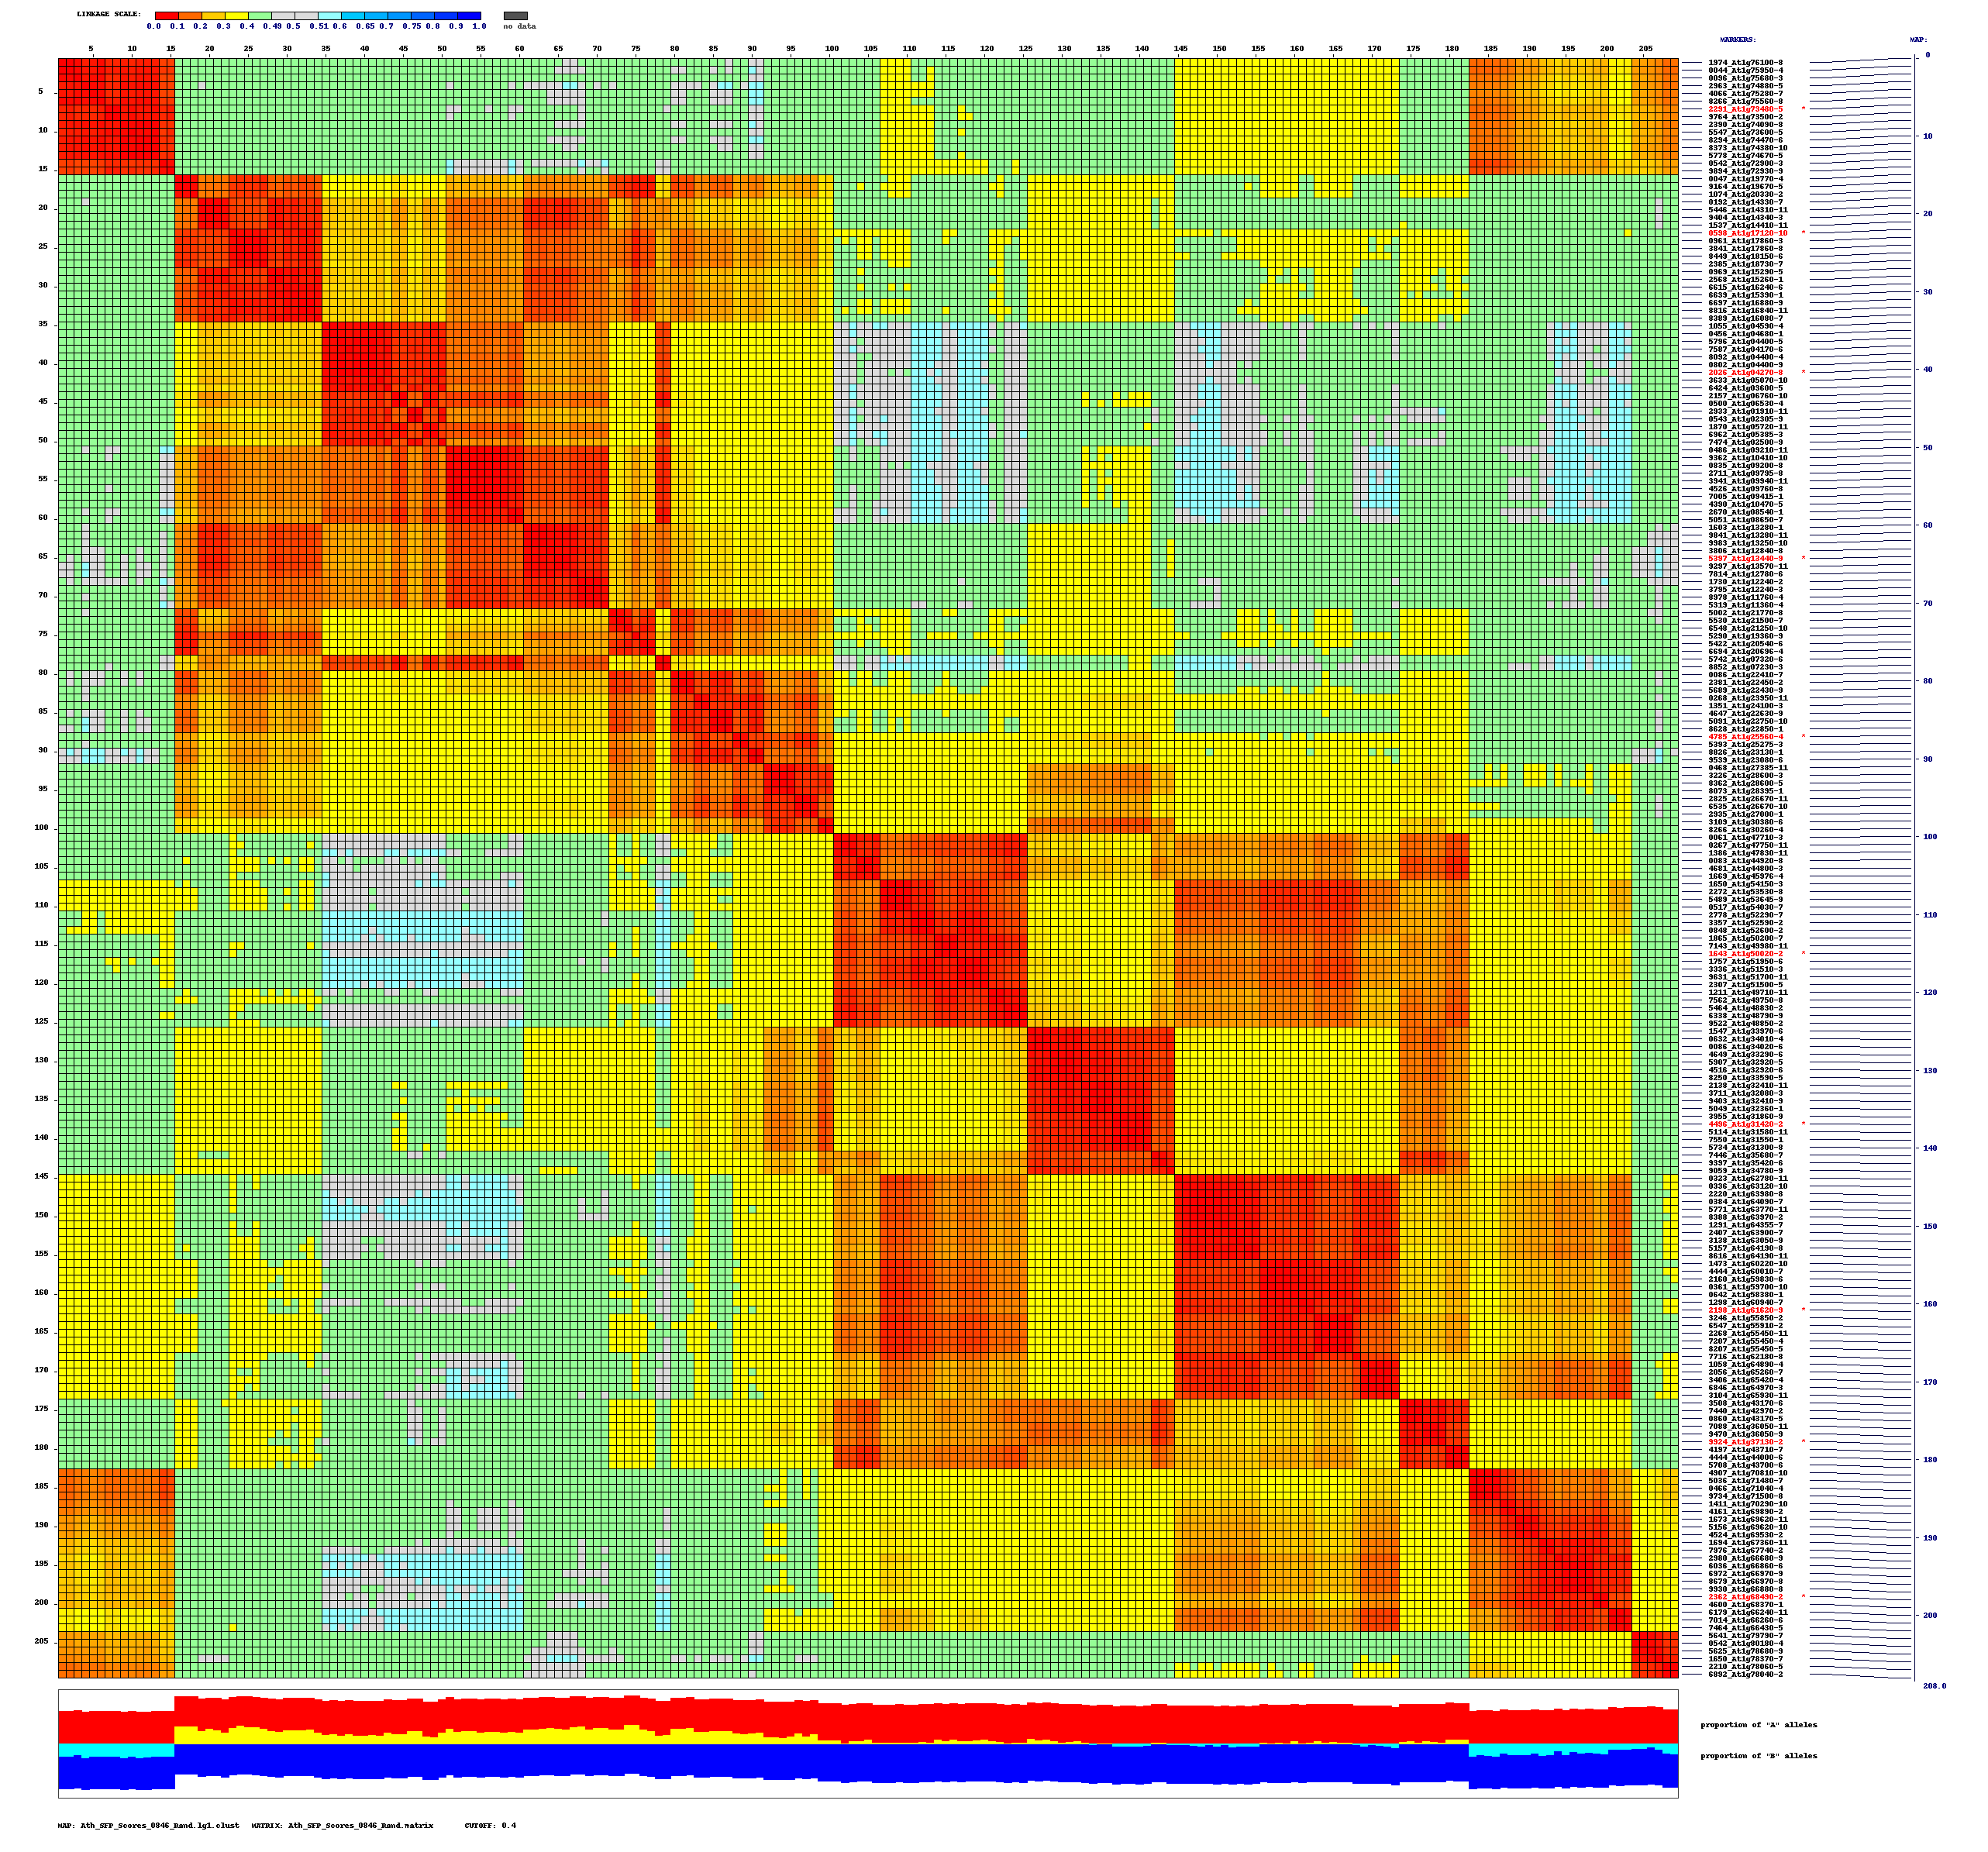
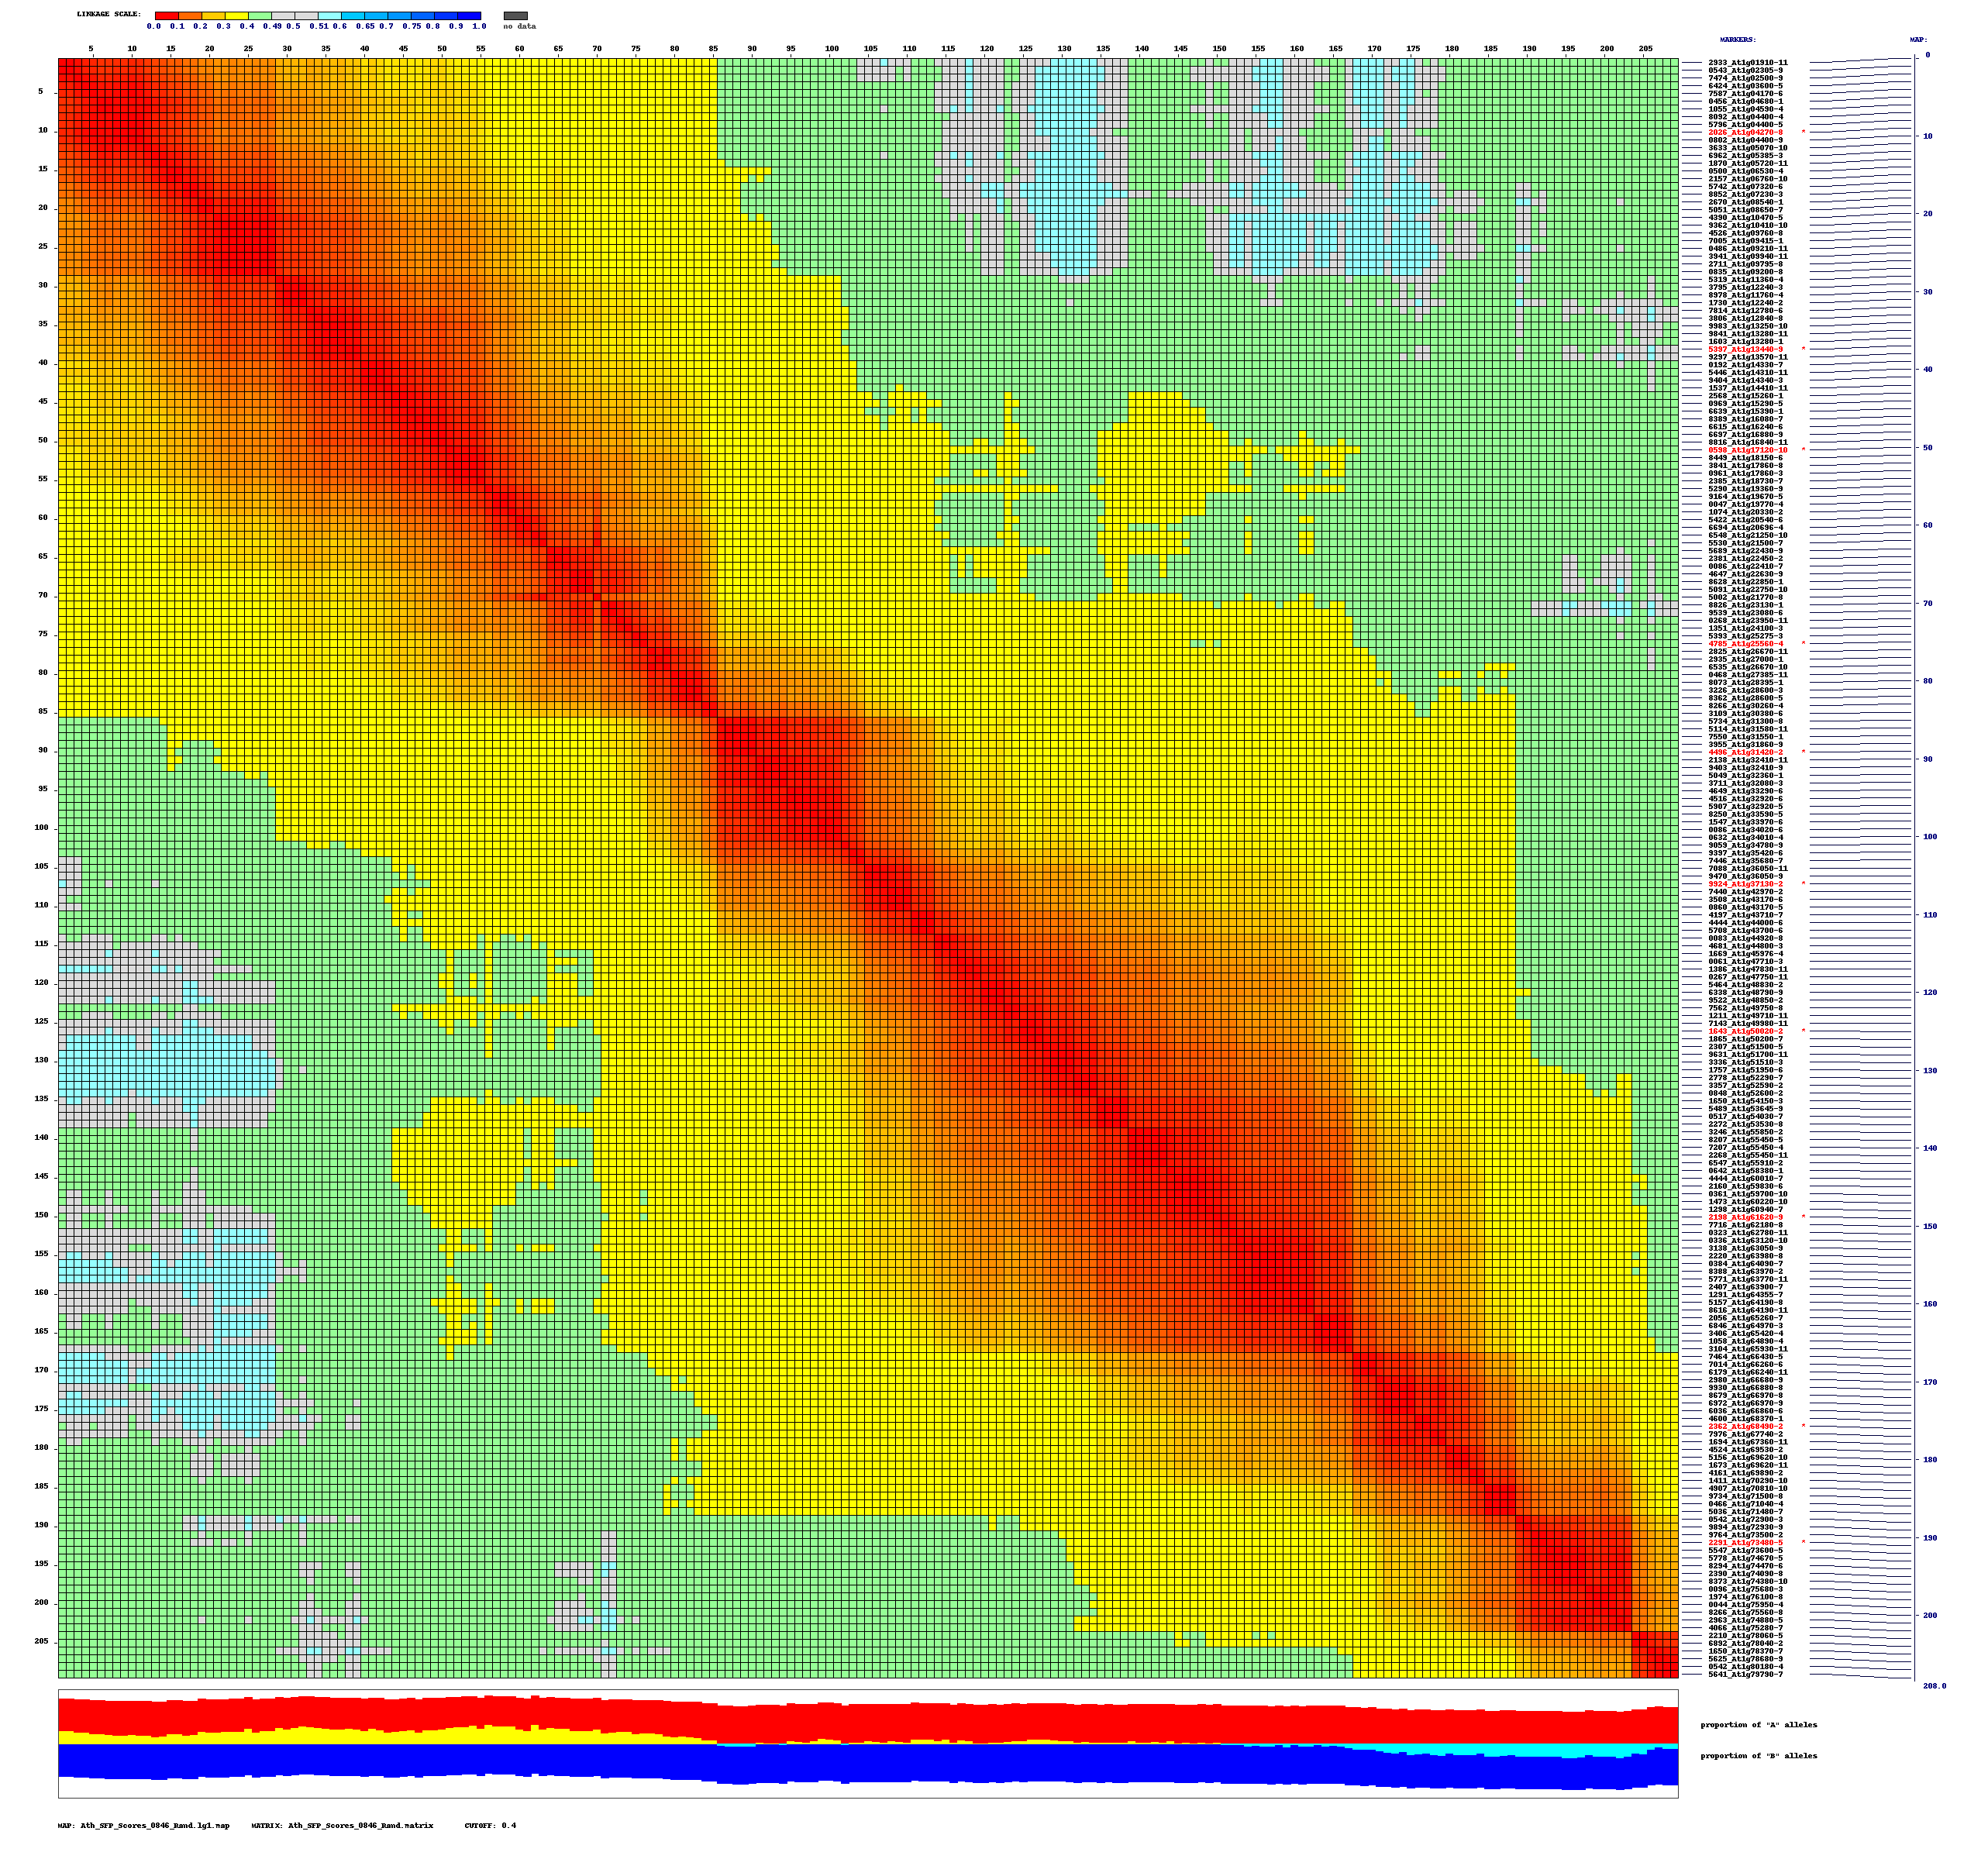
Linkage Group I: Ath_SFP_Scores_0846_Rand.lg1.clust
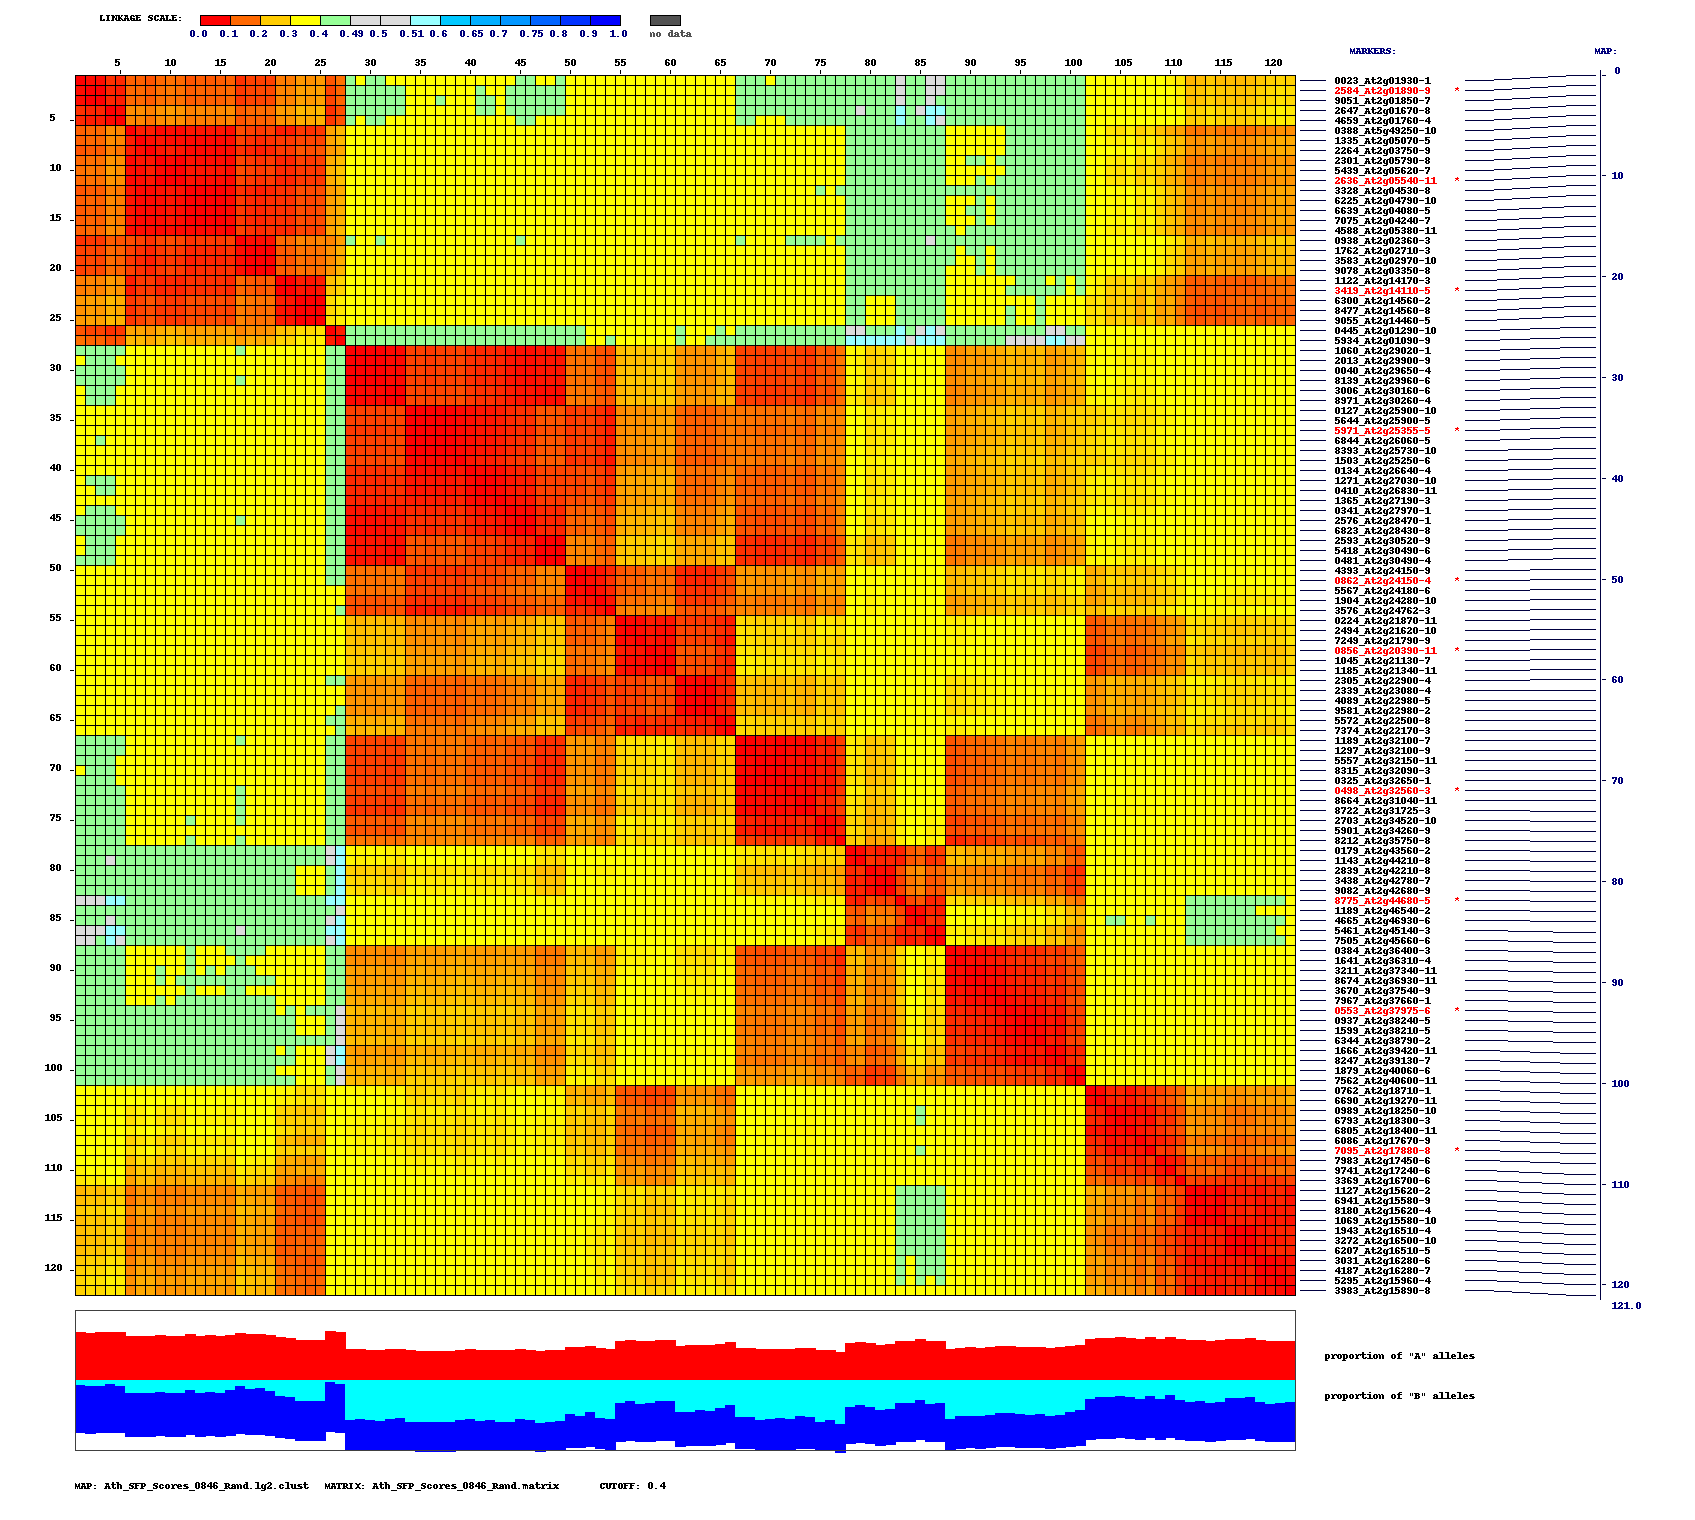
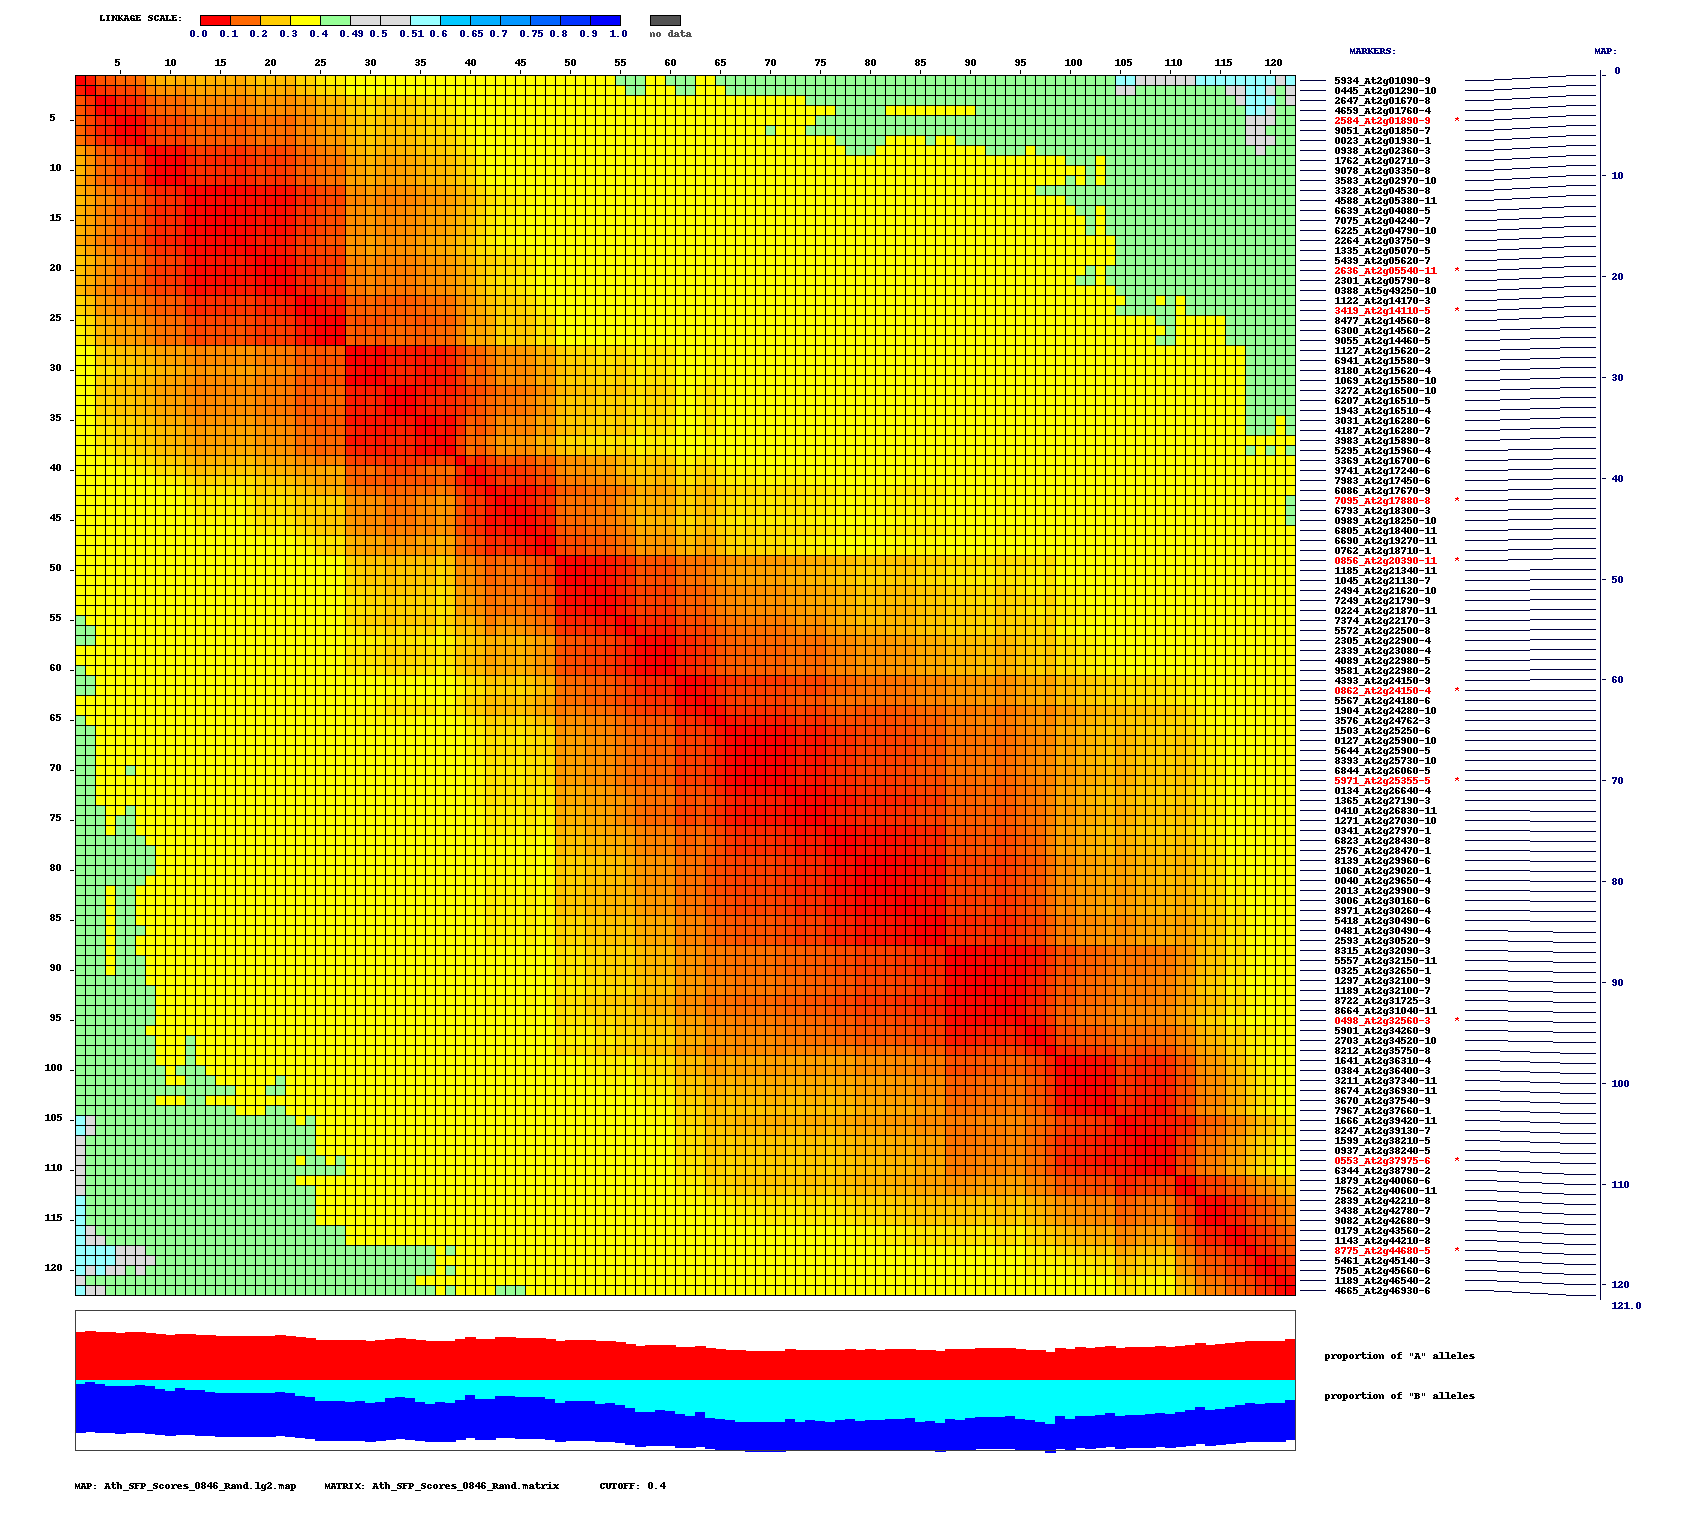
Linkage Group II: Ath_SFP_Scores_0846_Rand.lg2.clust
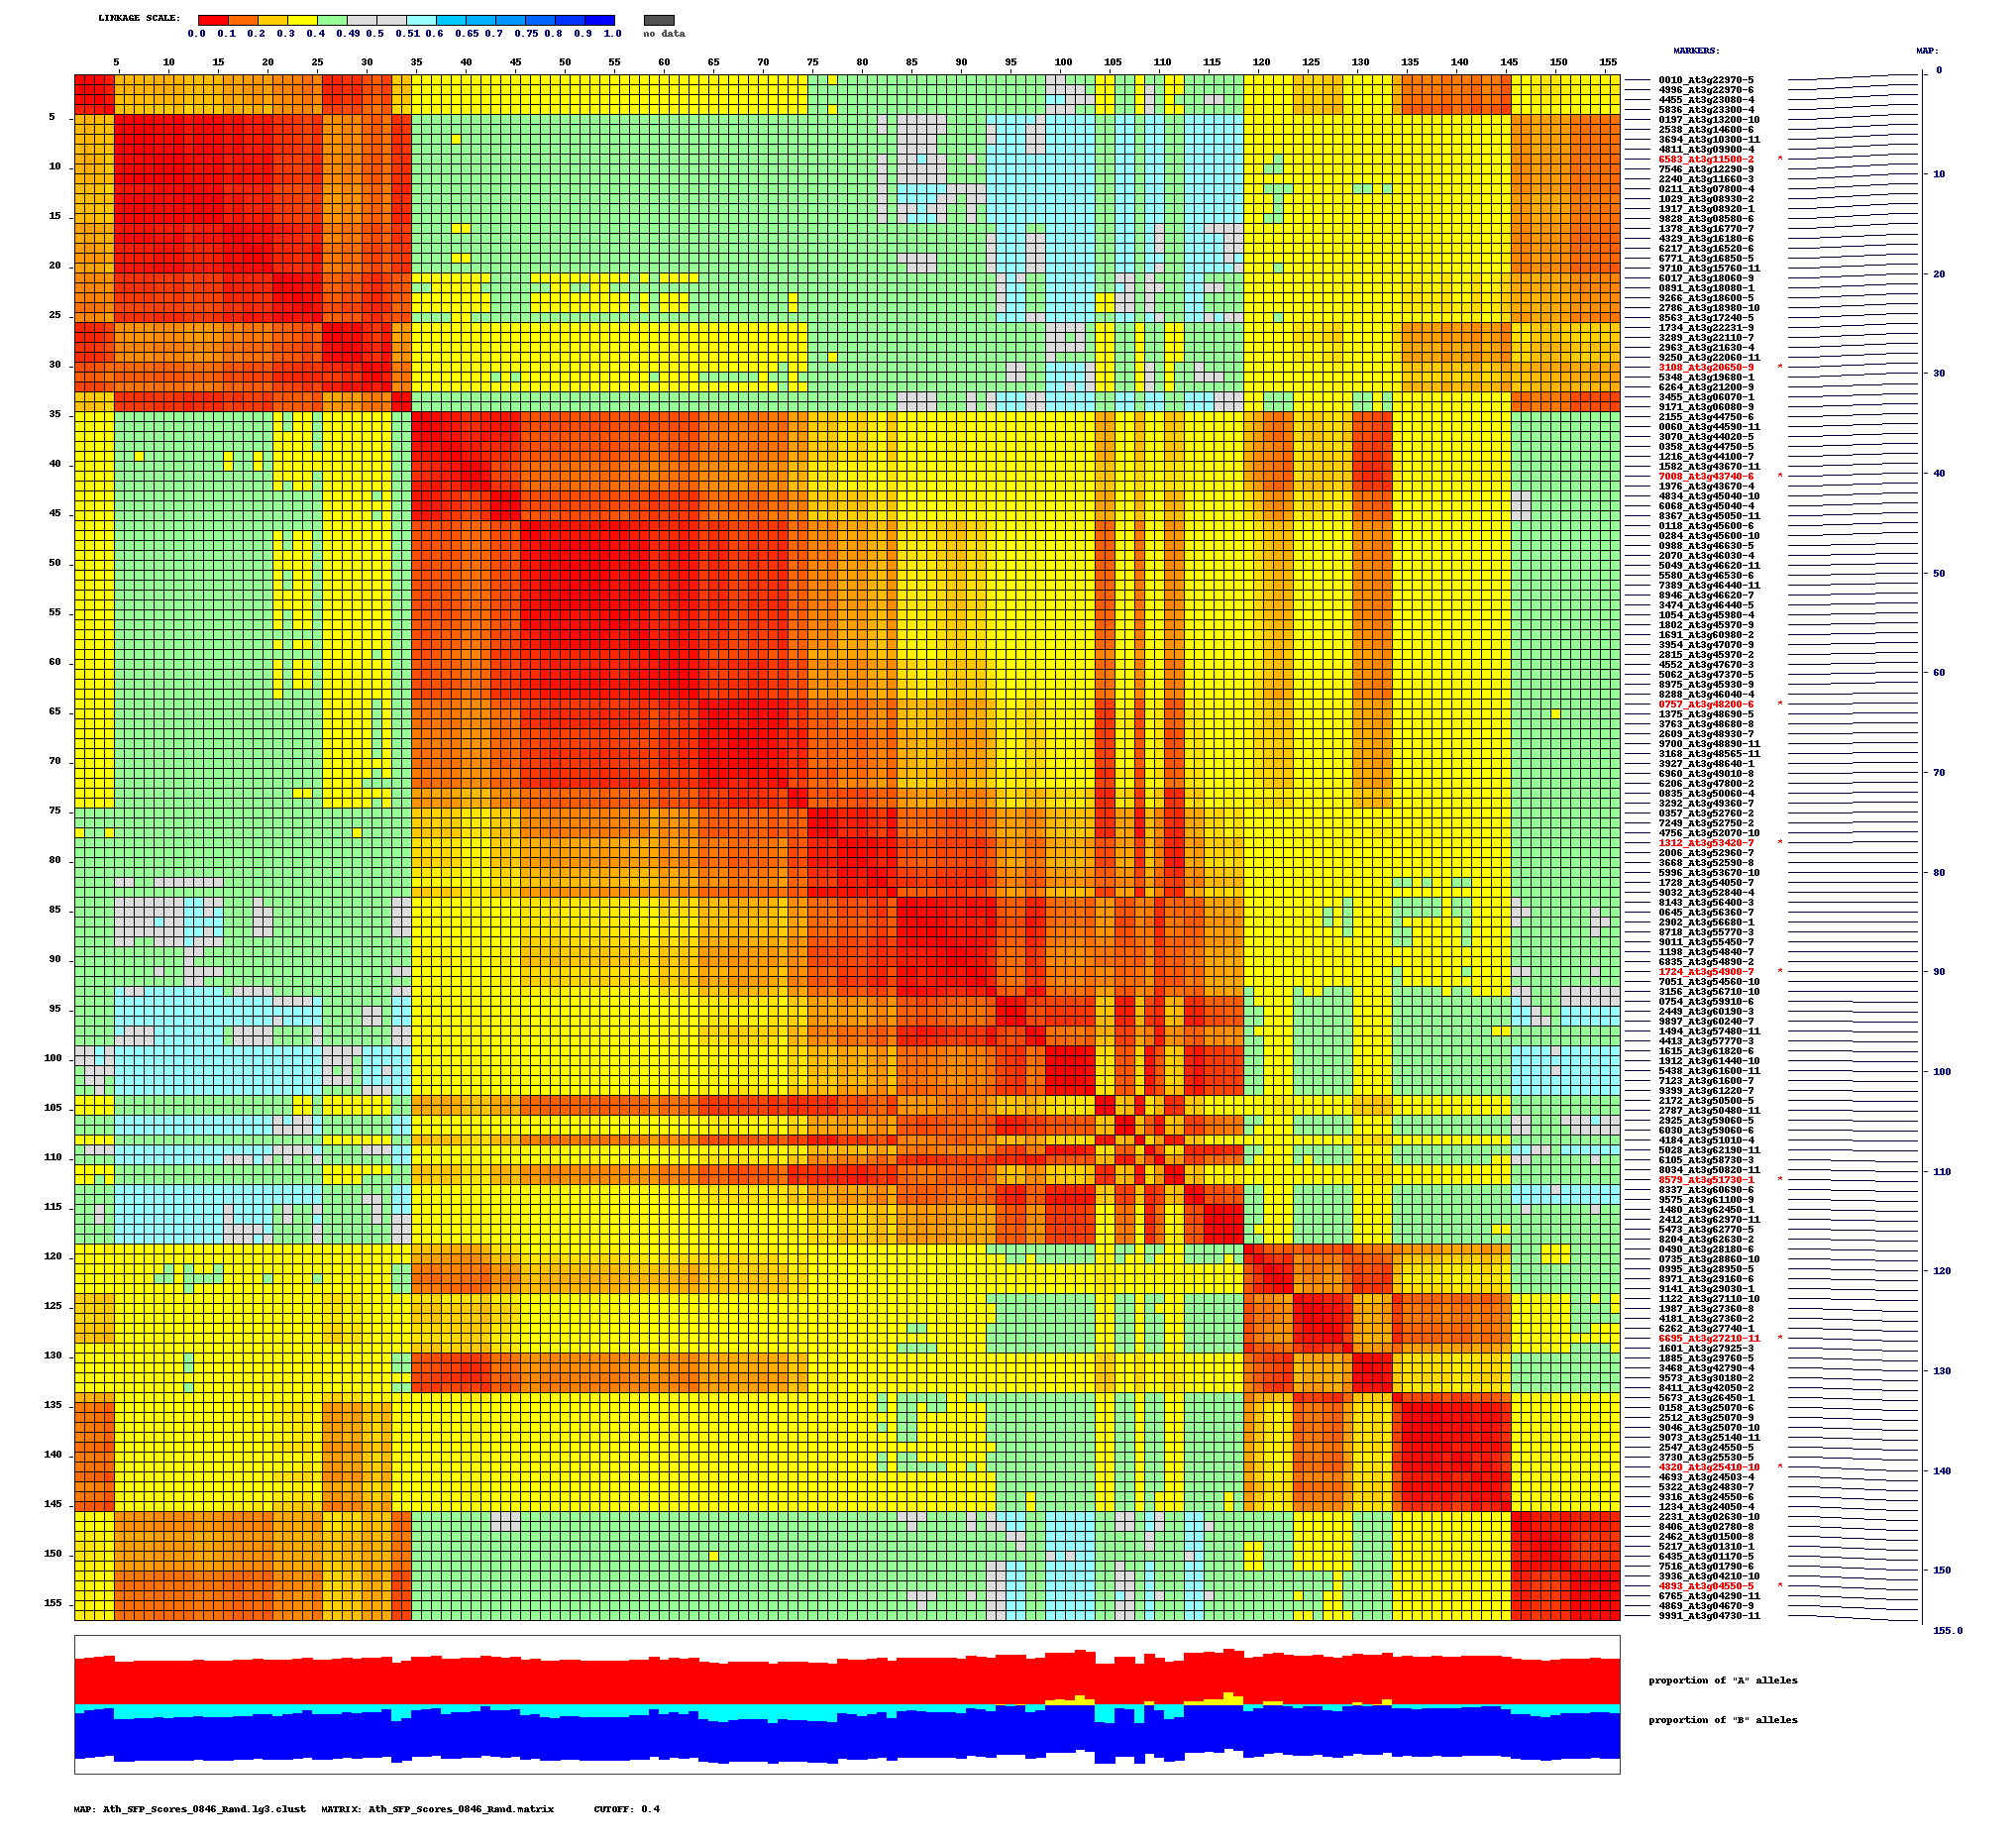
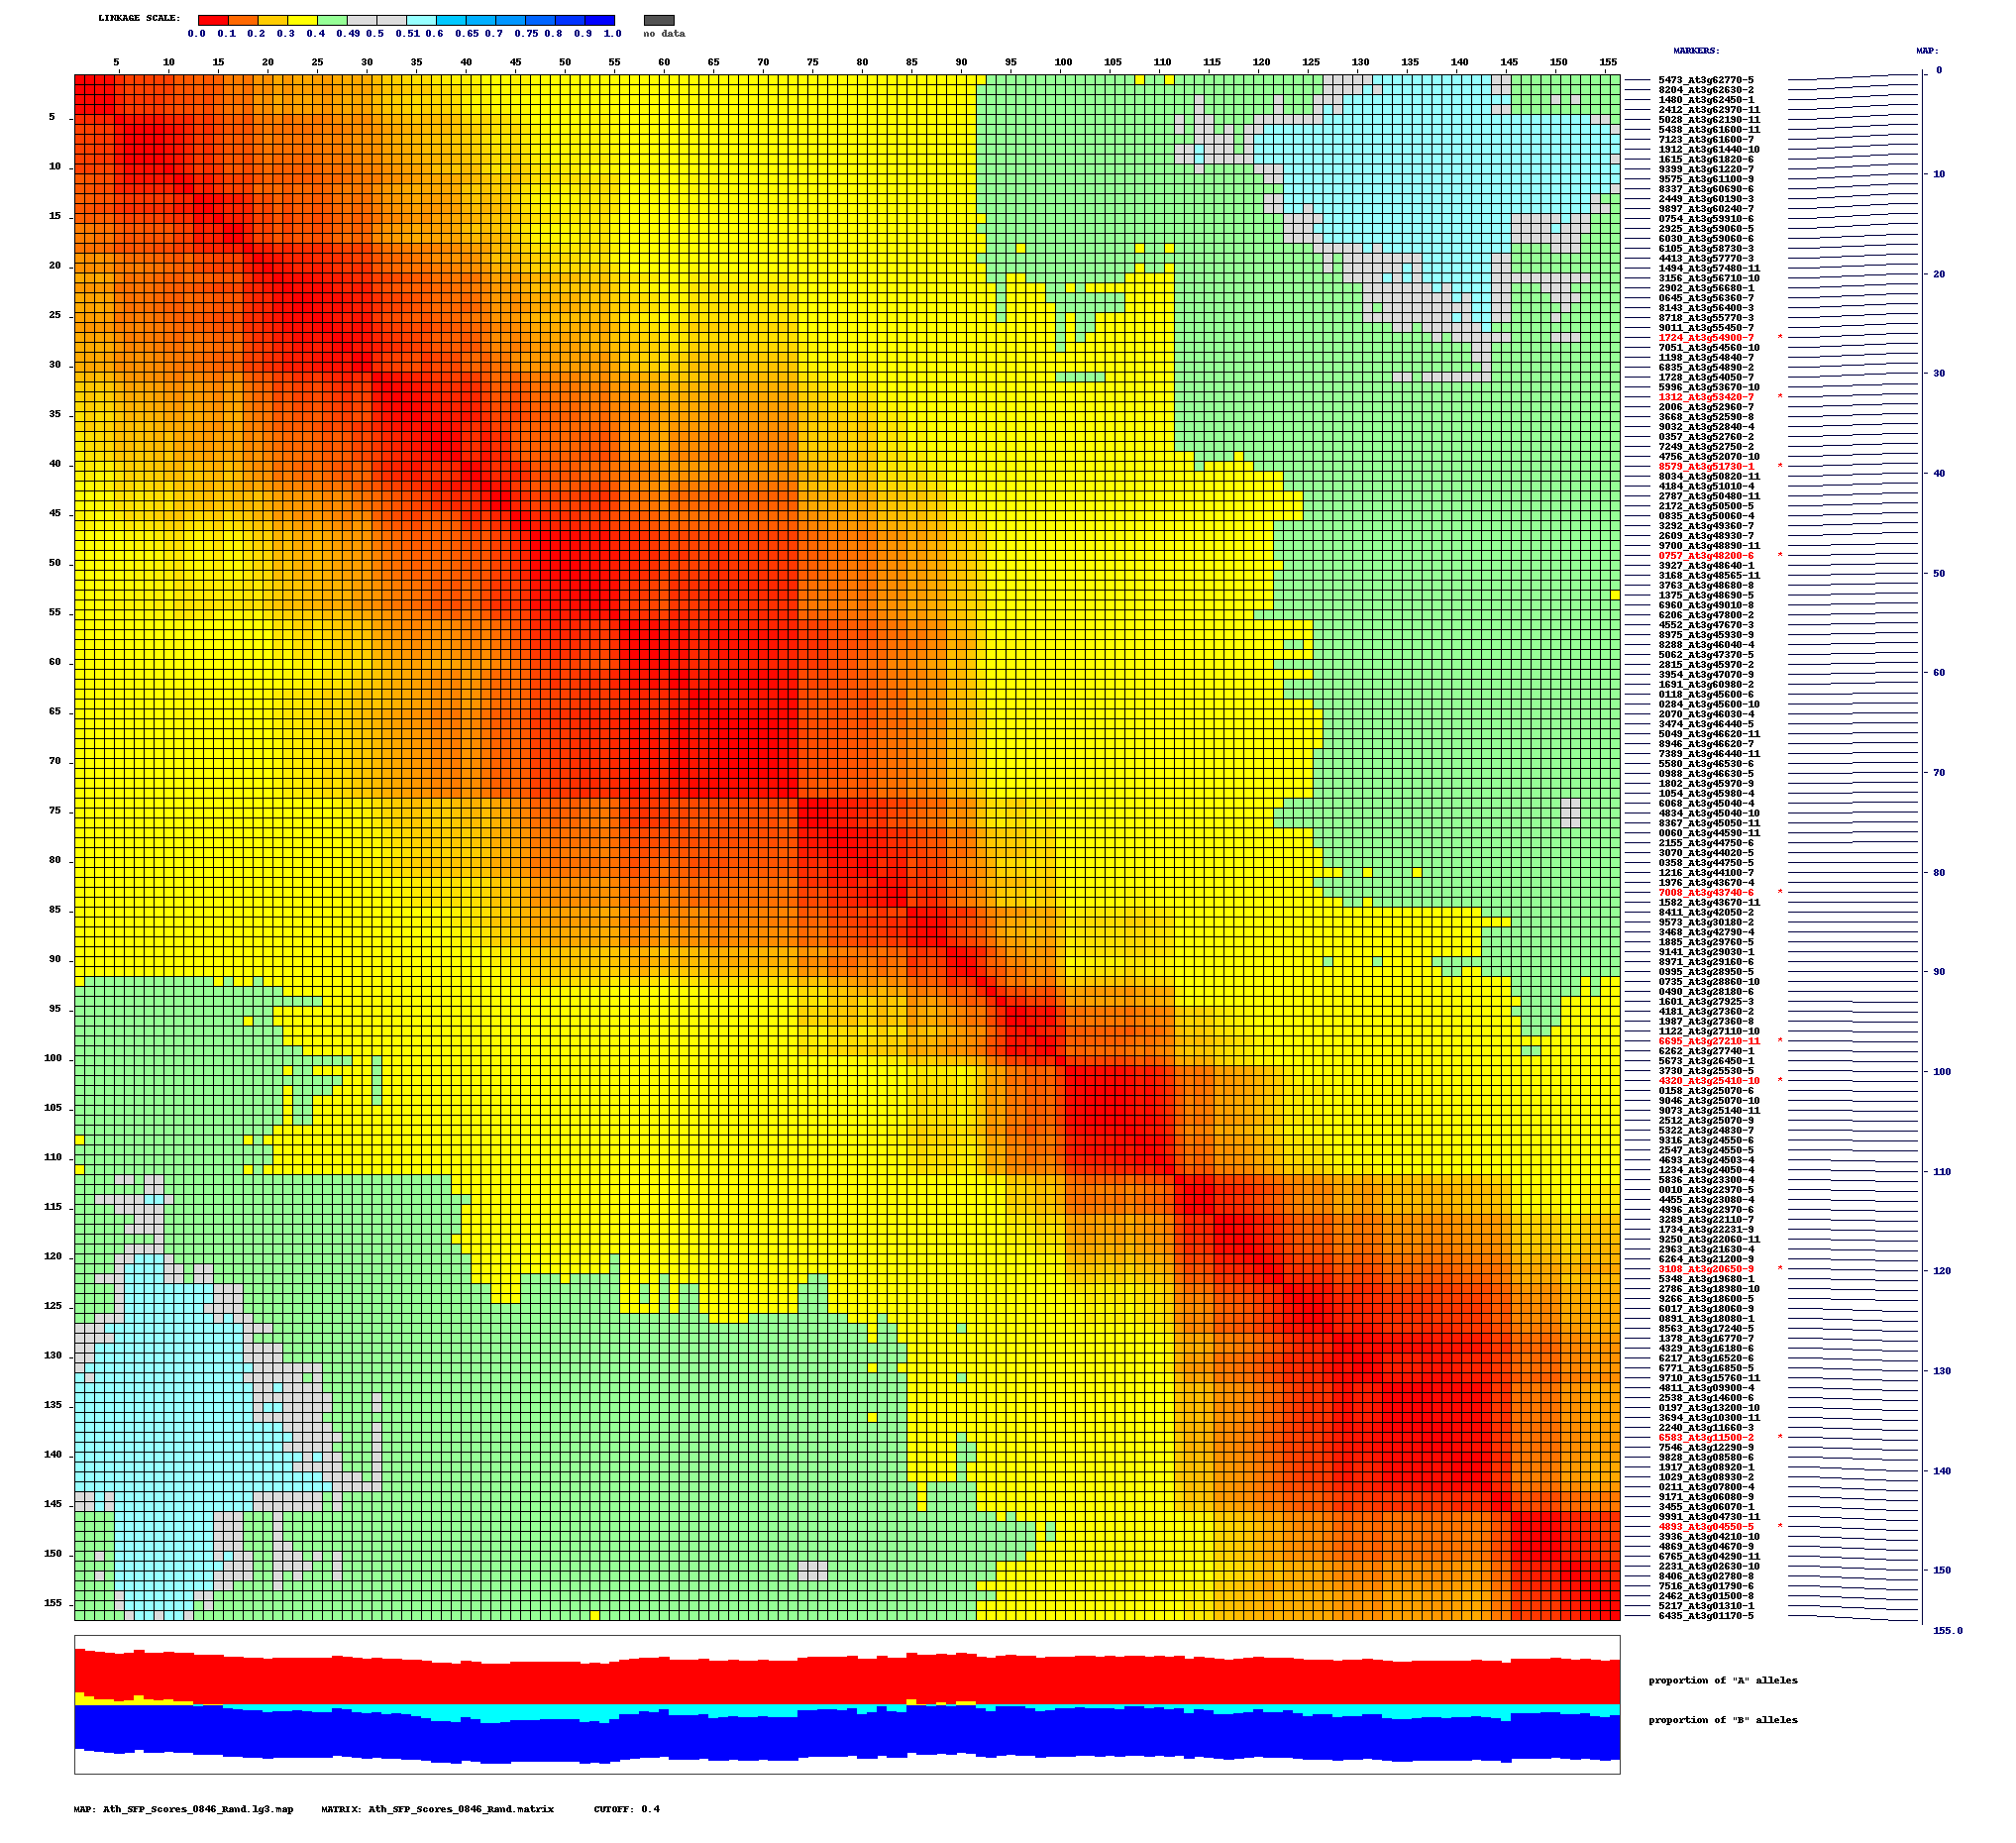
Linkage Group III: Ath_SFP_Scores_0846_Rand.lg3.clust
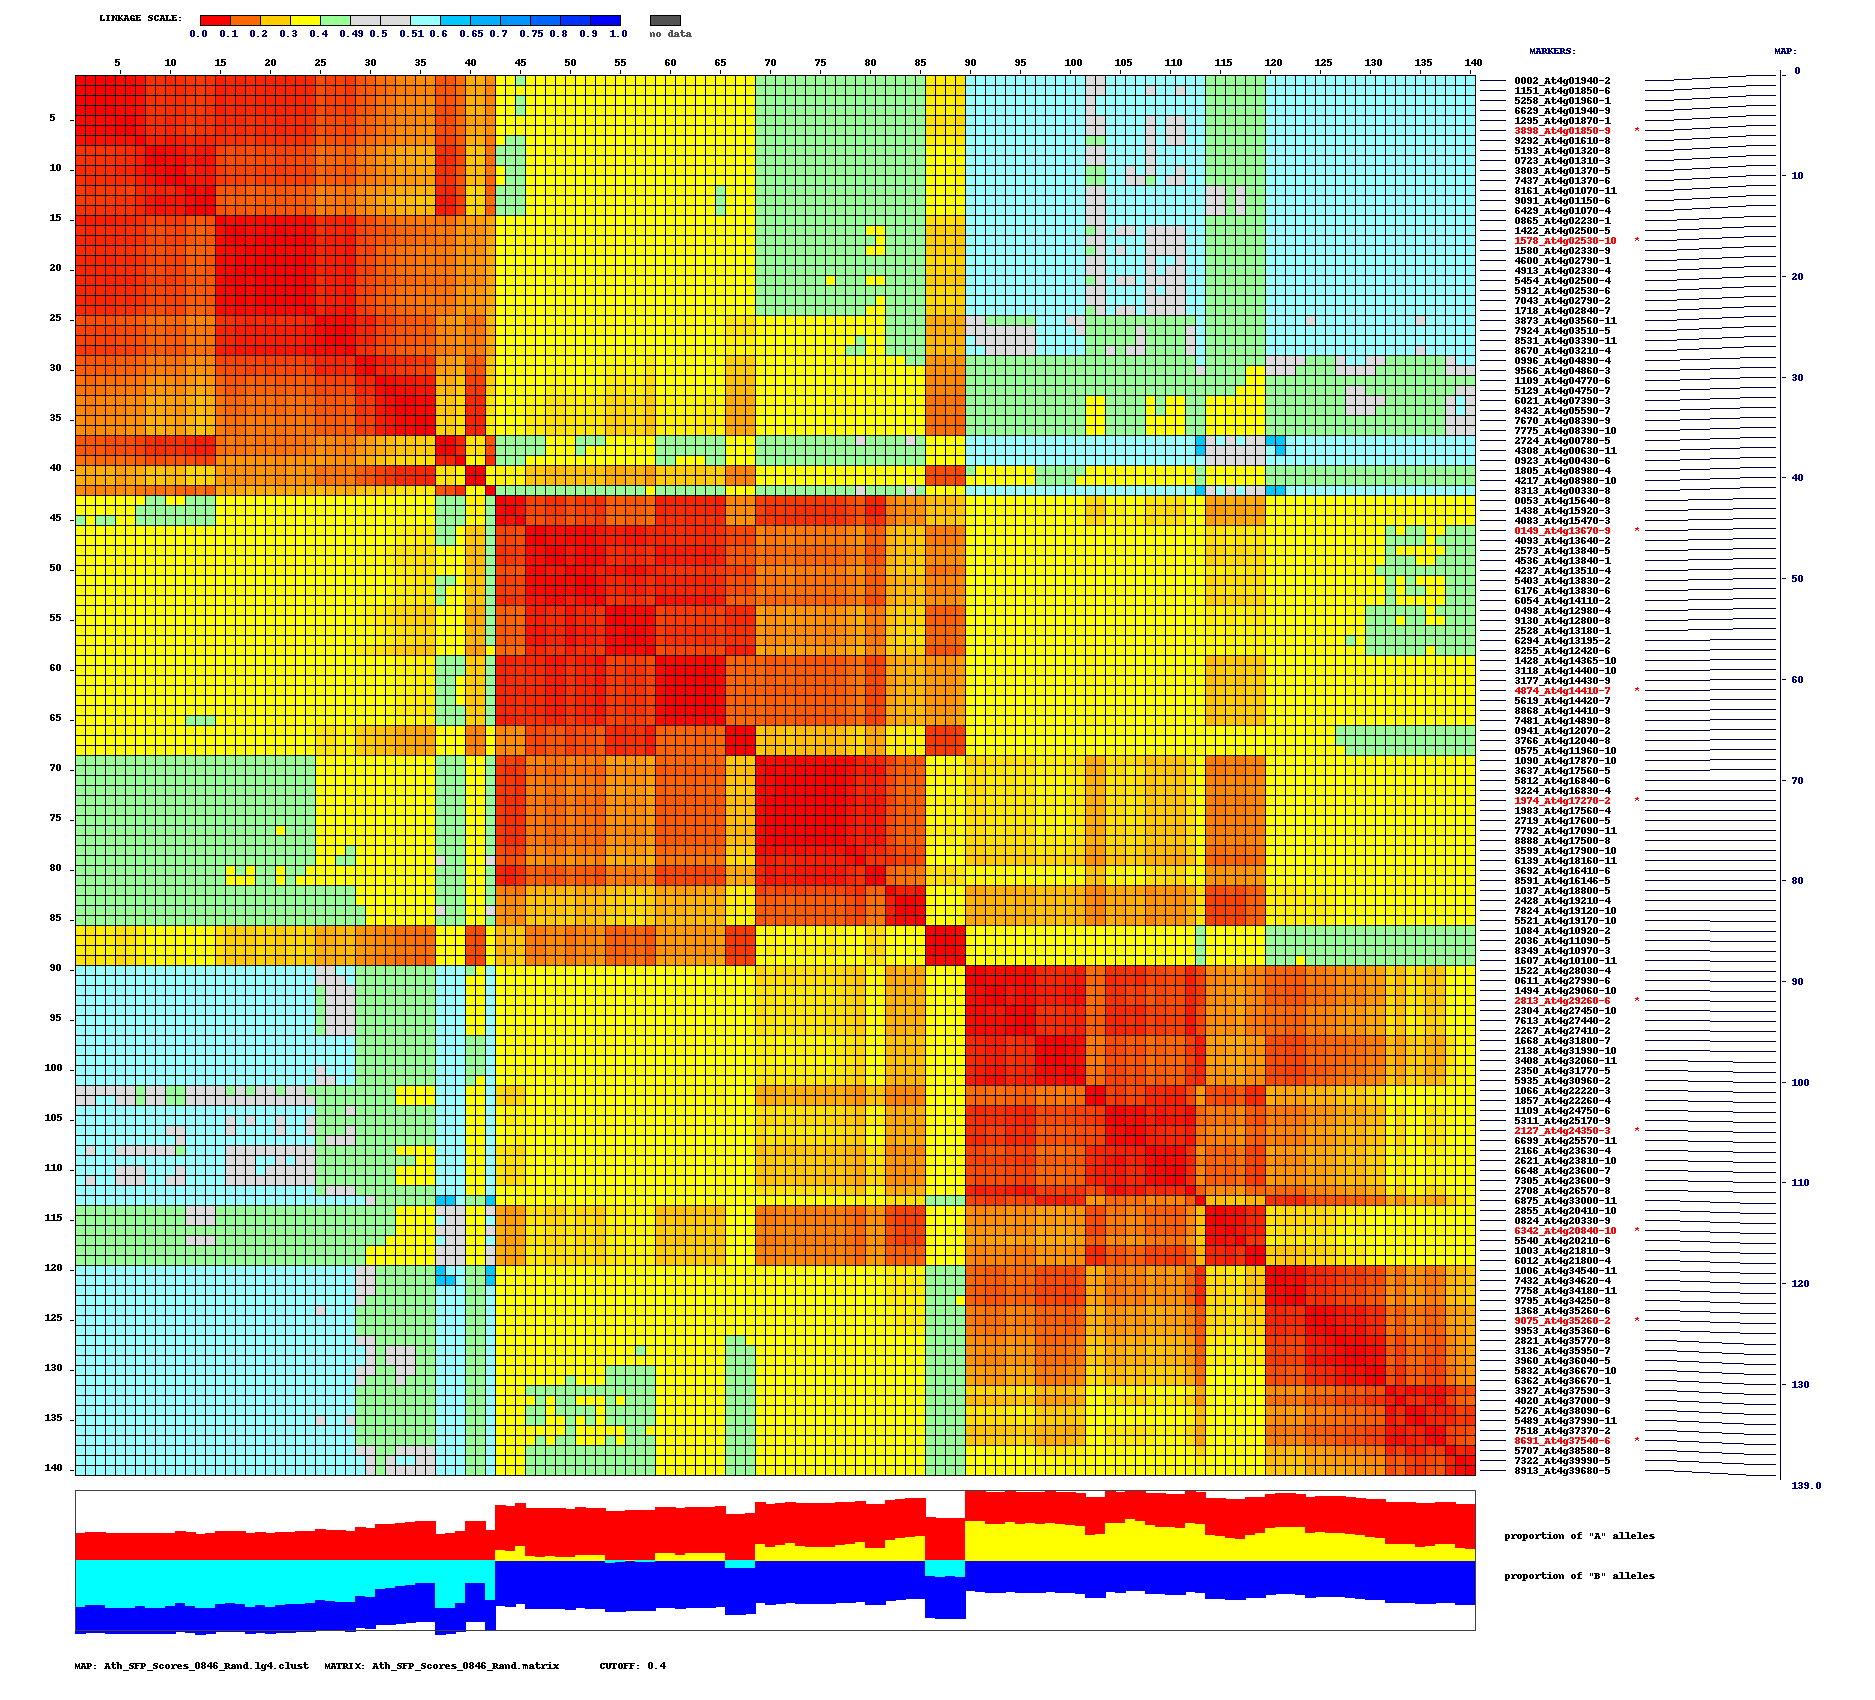
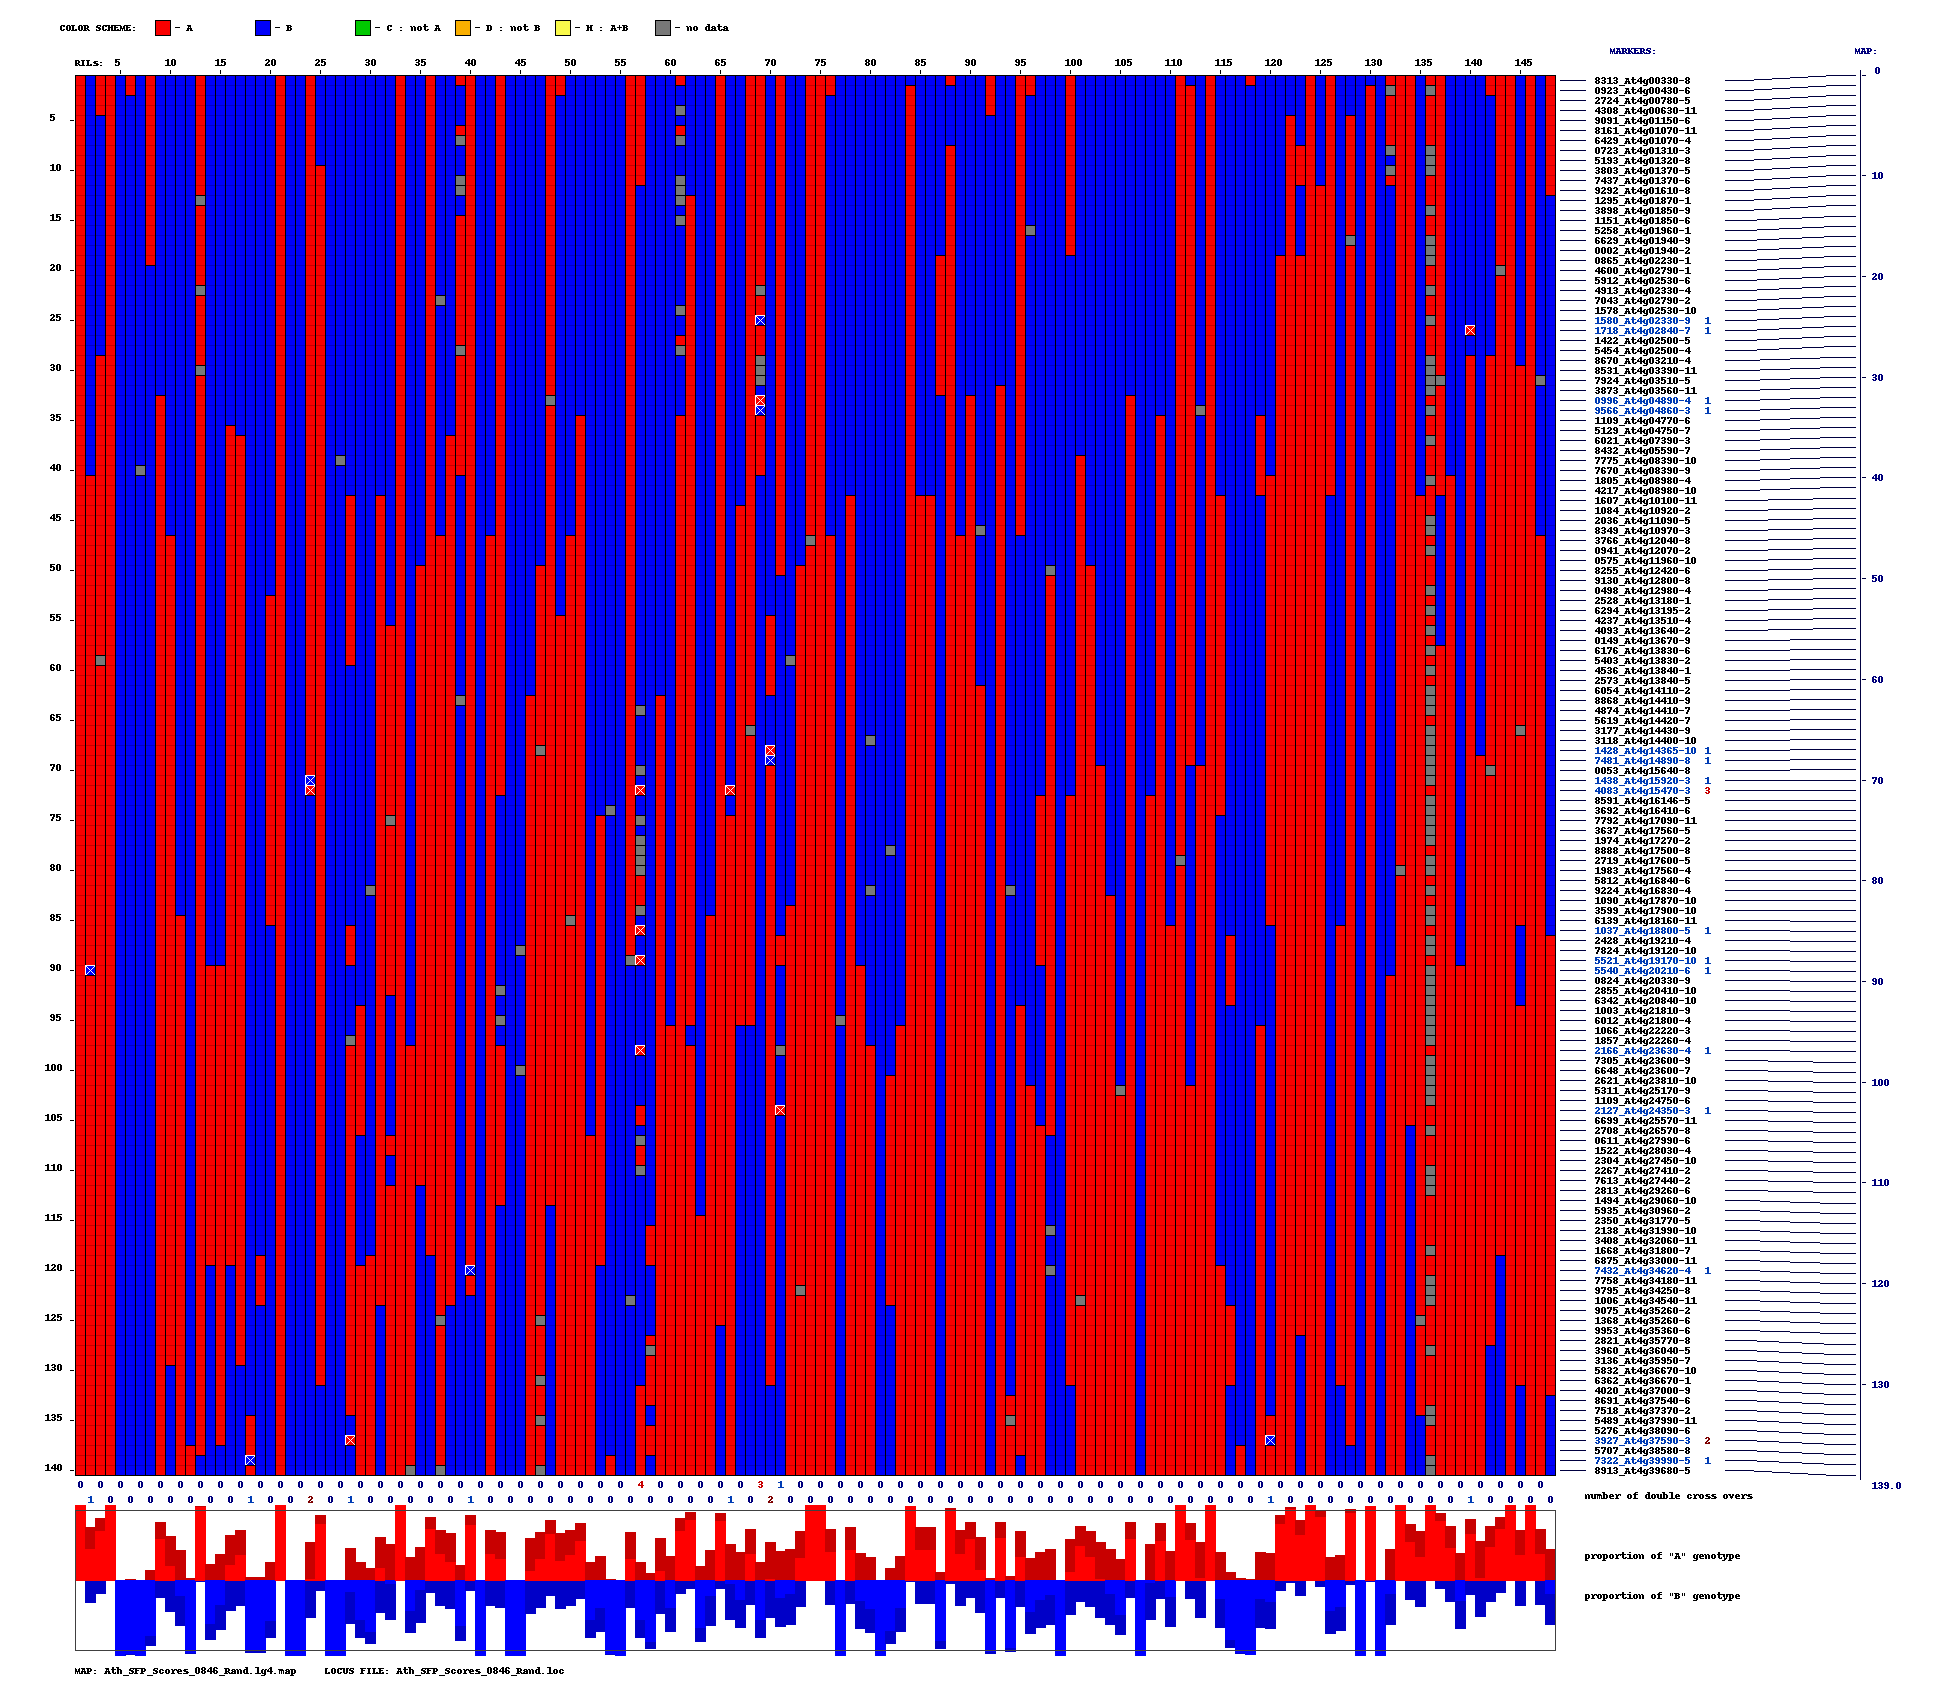
Linkage Group IV: Ath_SFP_Scores_0846_Rand.lg4.clust
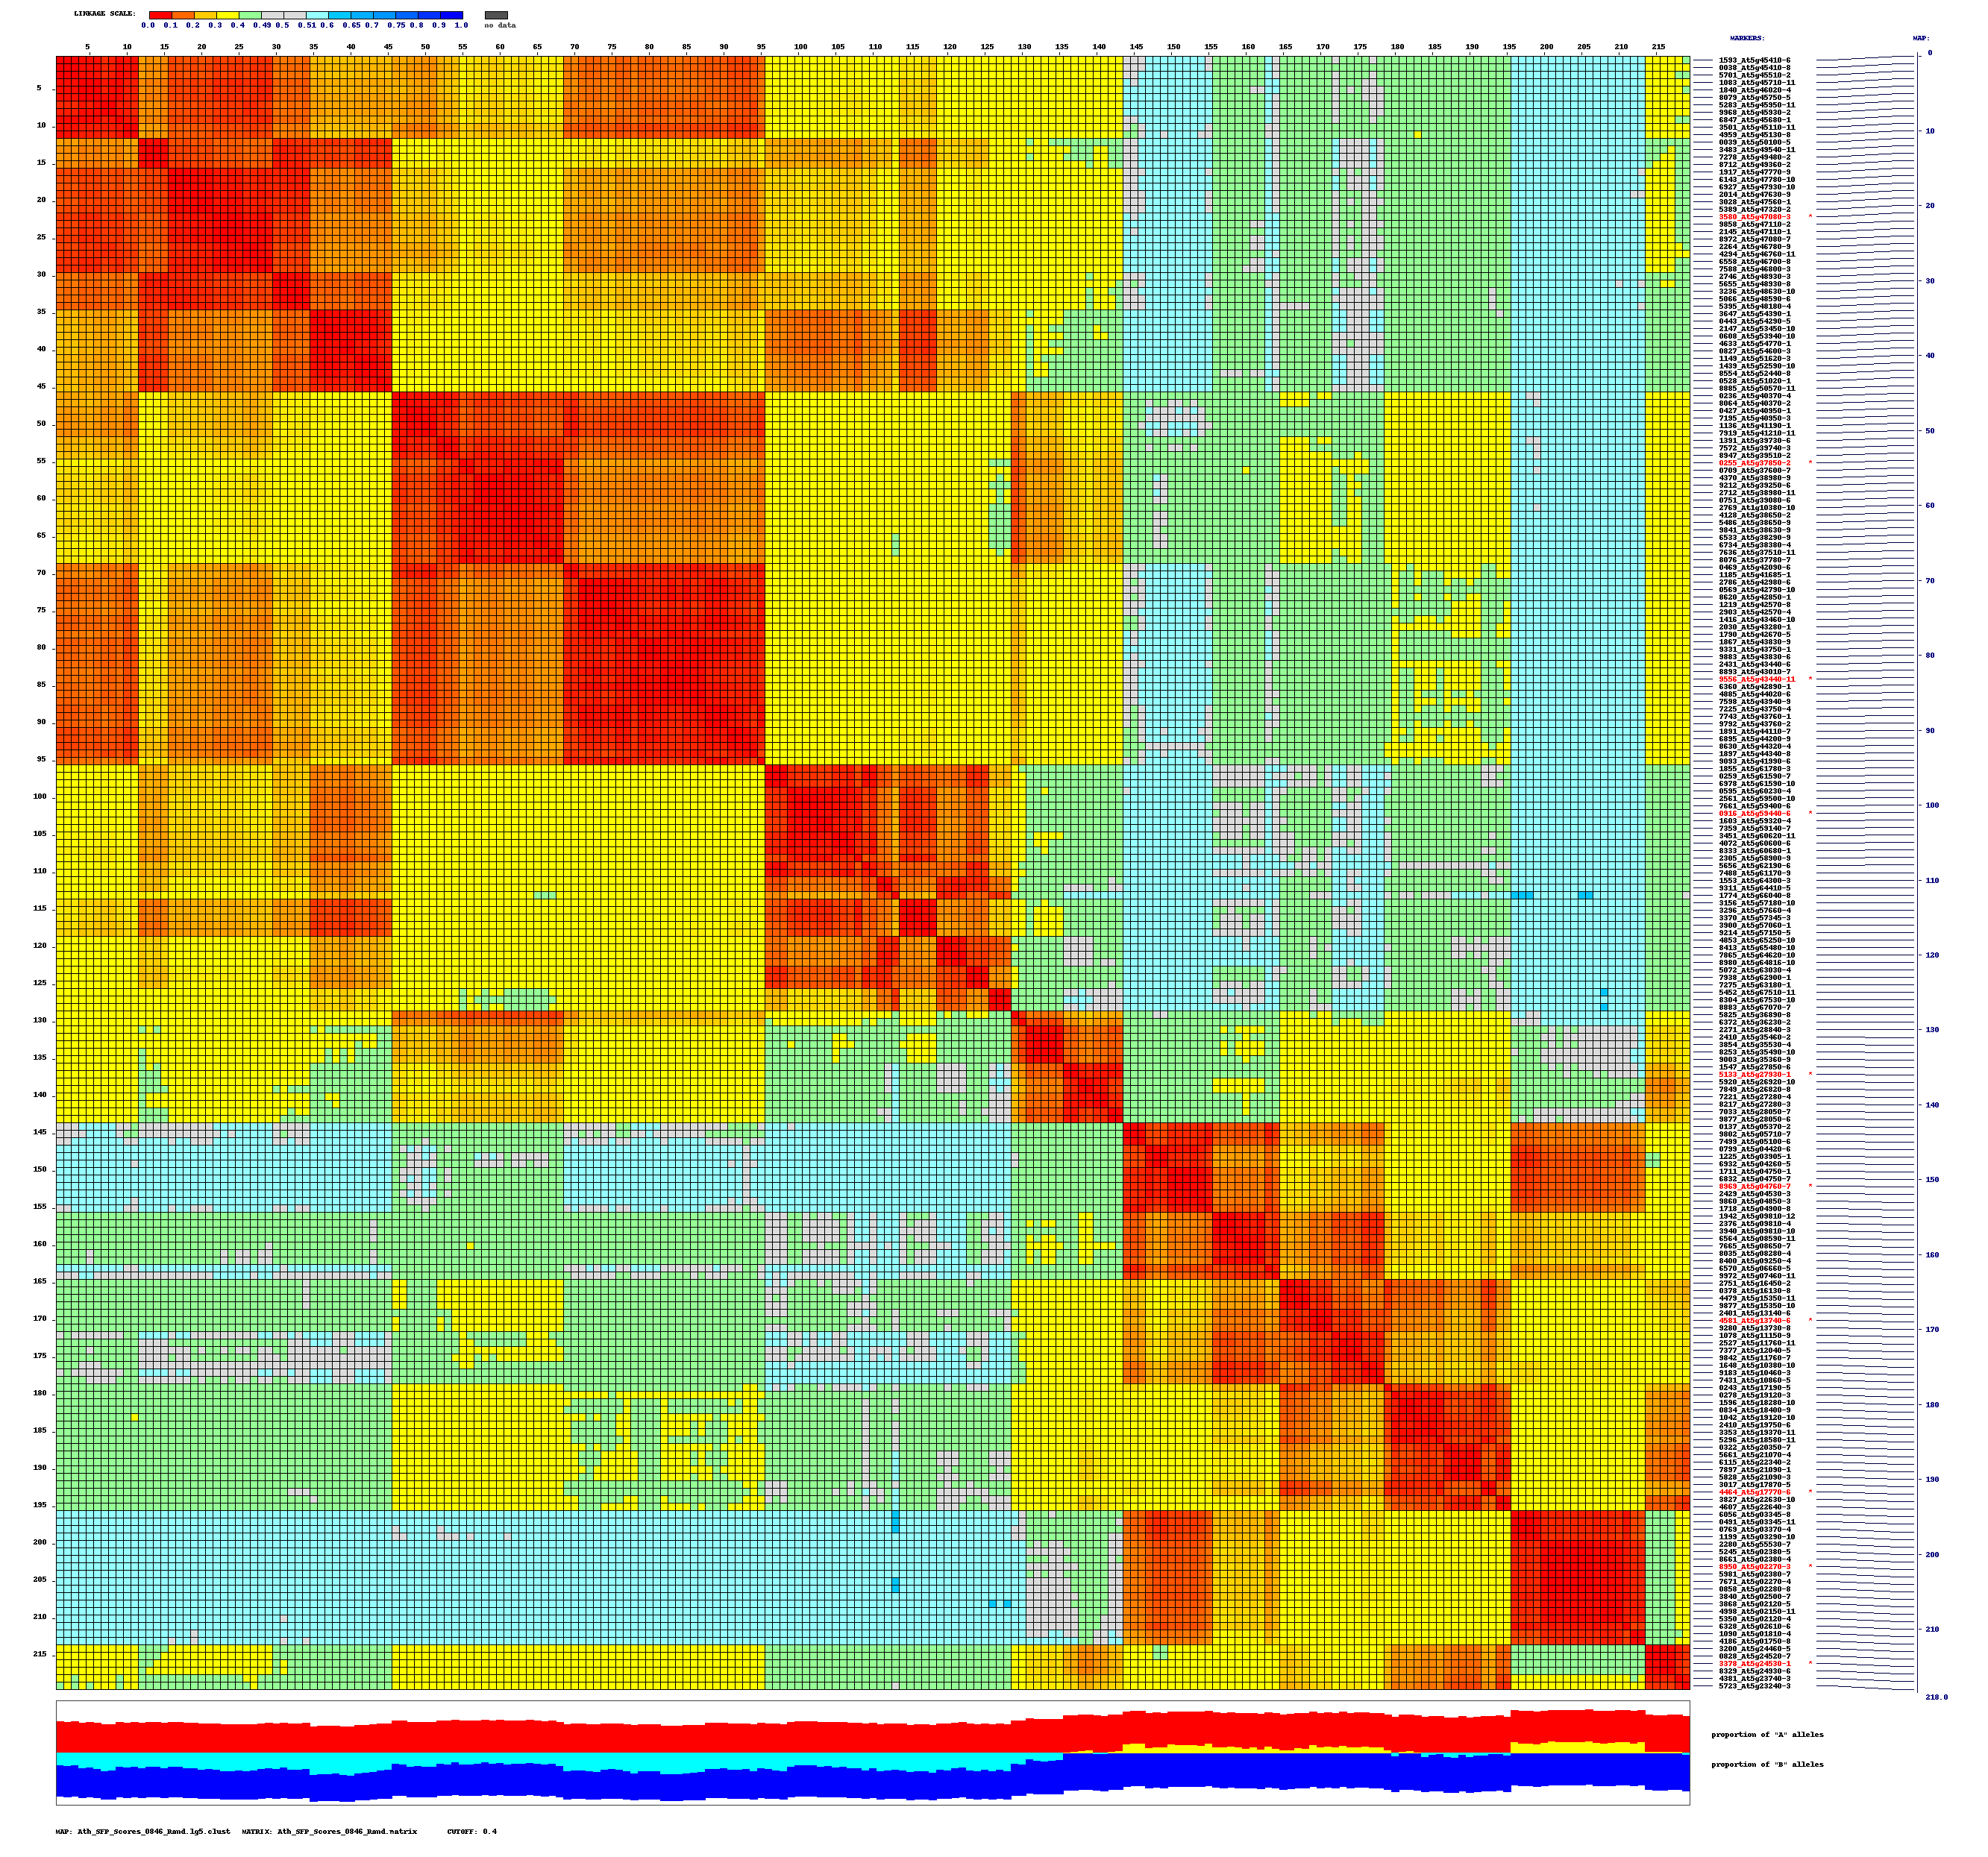
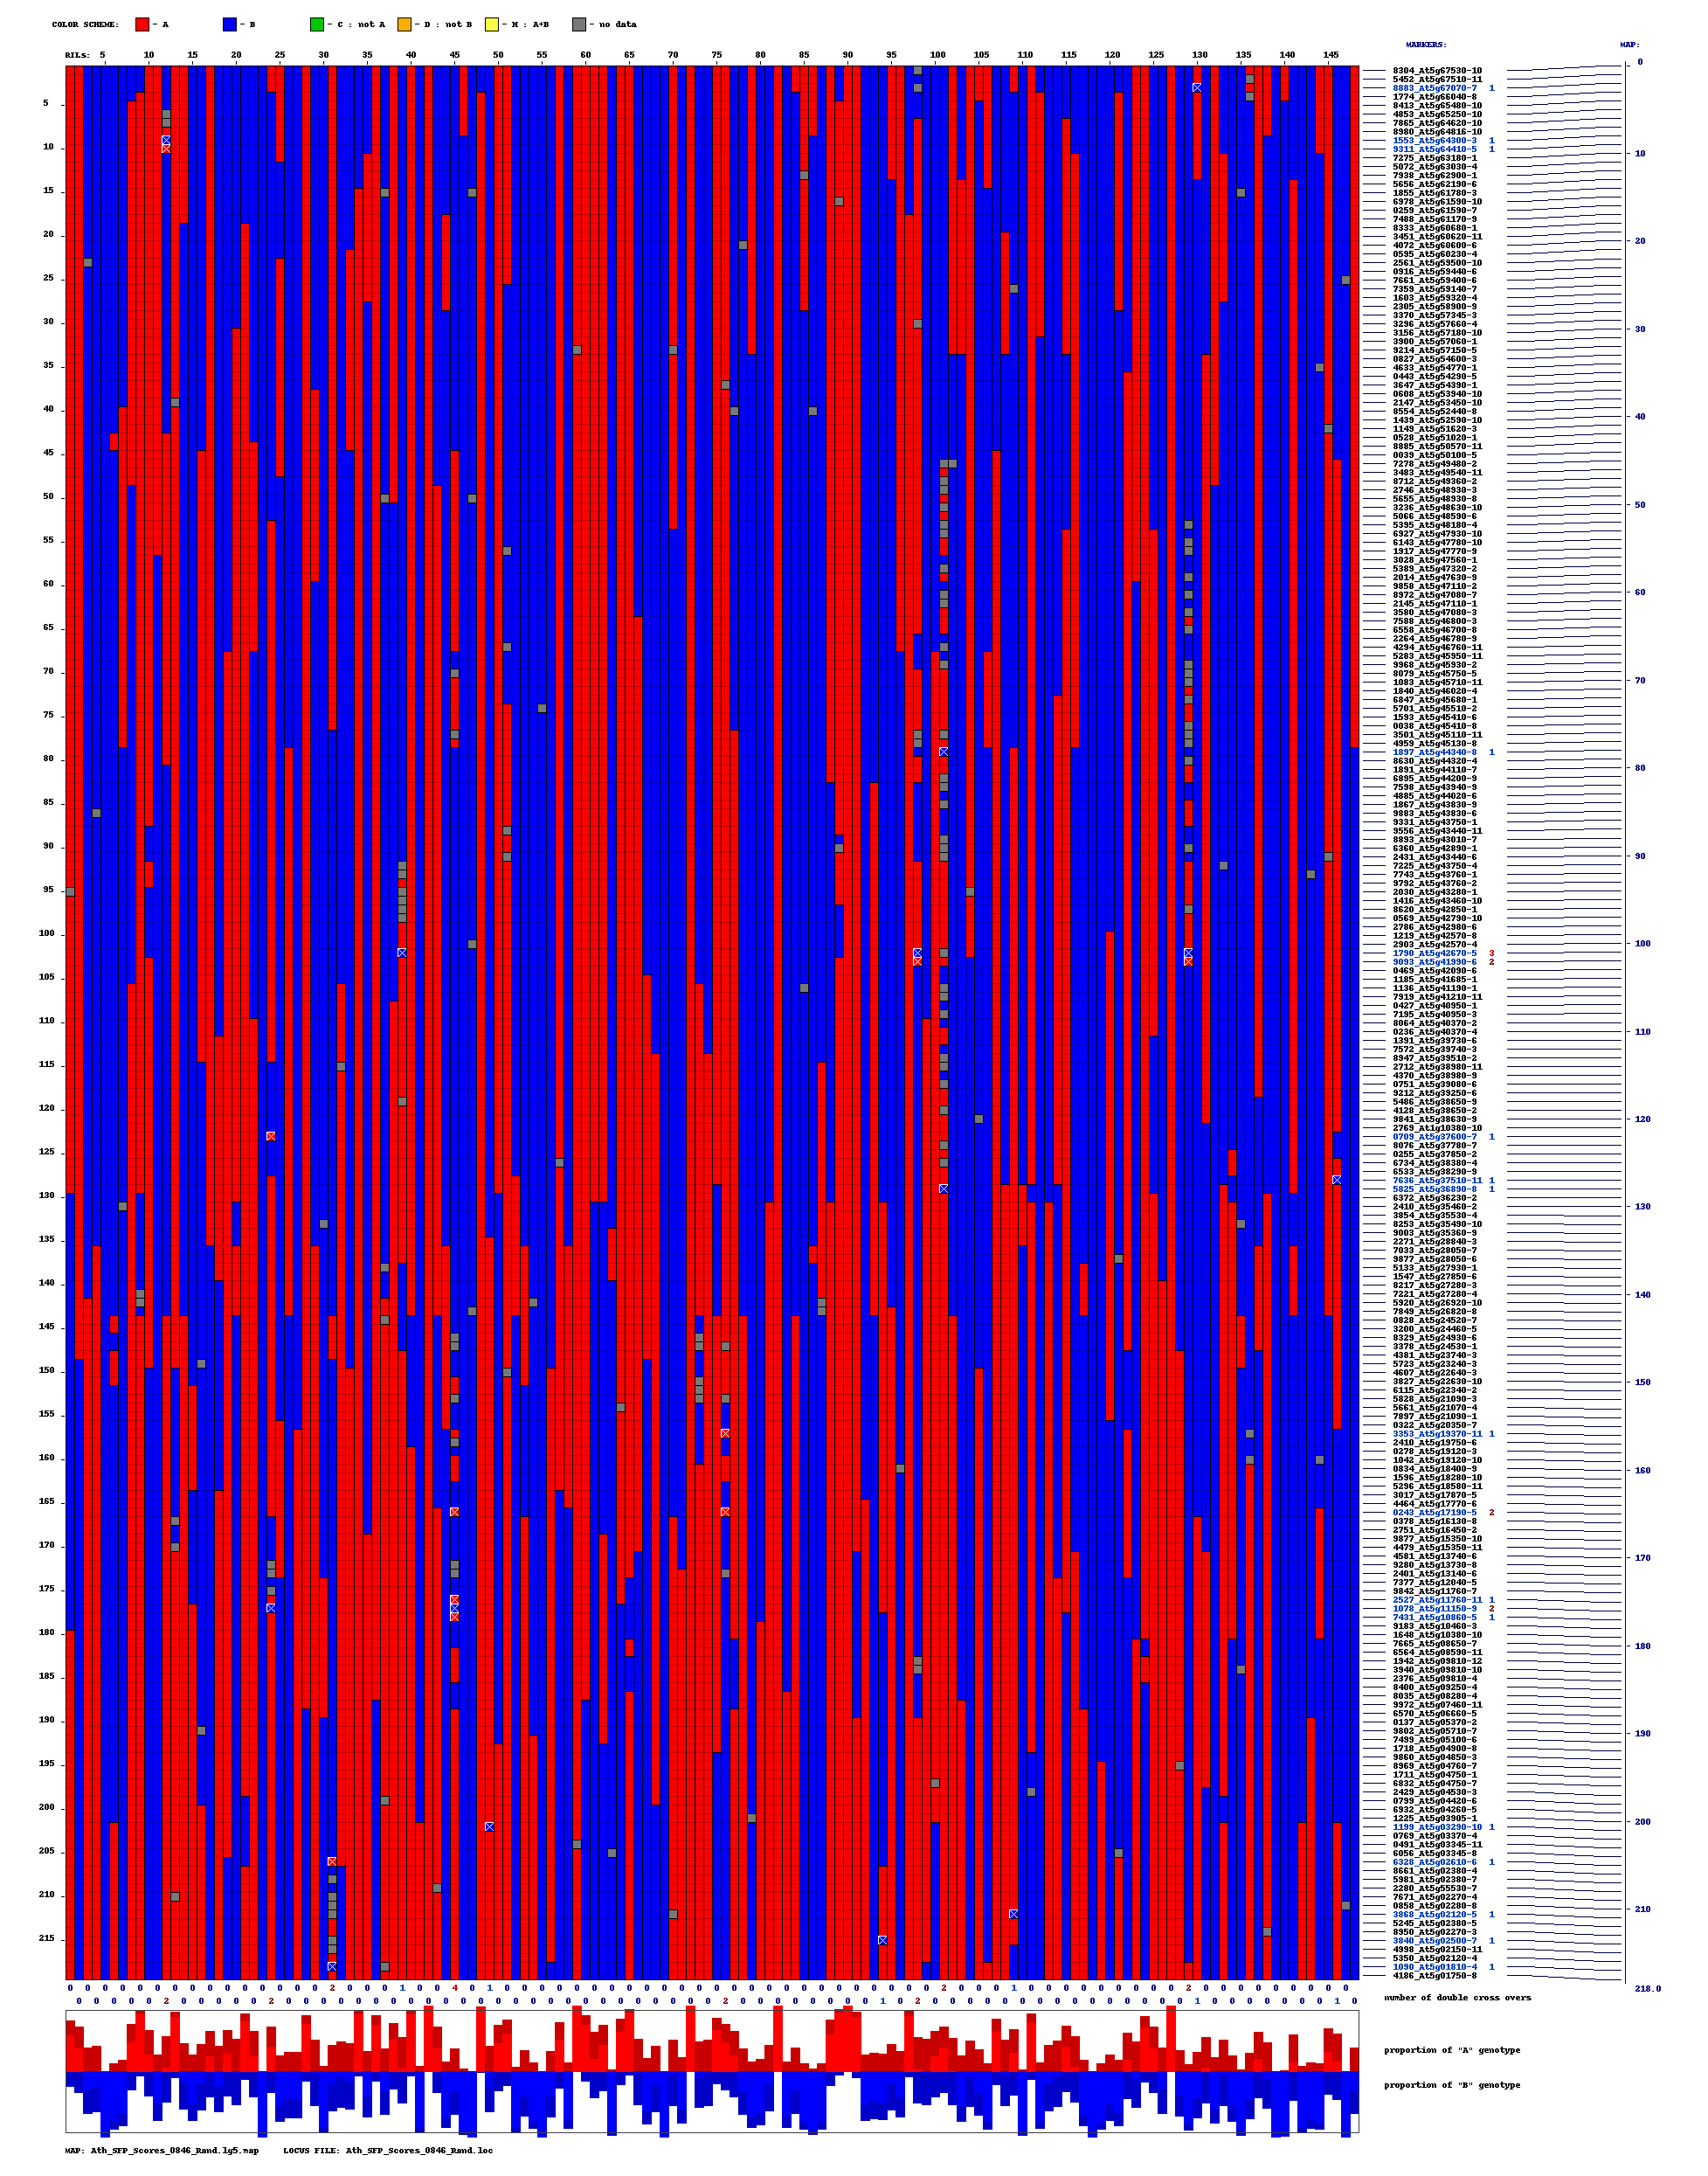
Linkage Group V: Ath_SFP_Scores_0846_Rand.lg5.clust
(note, that markers are ordered in the same order as in clustering/grouping info file)
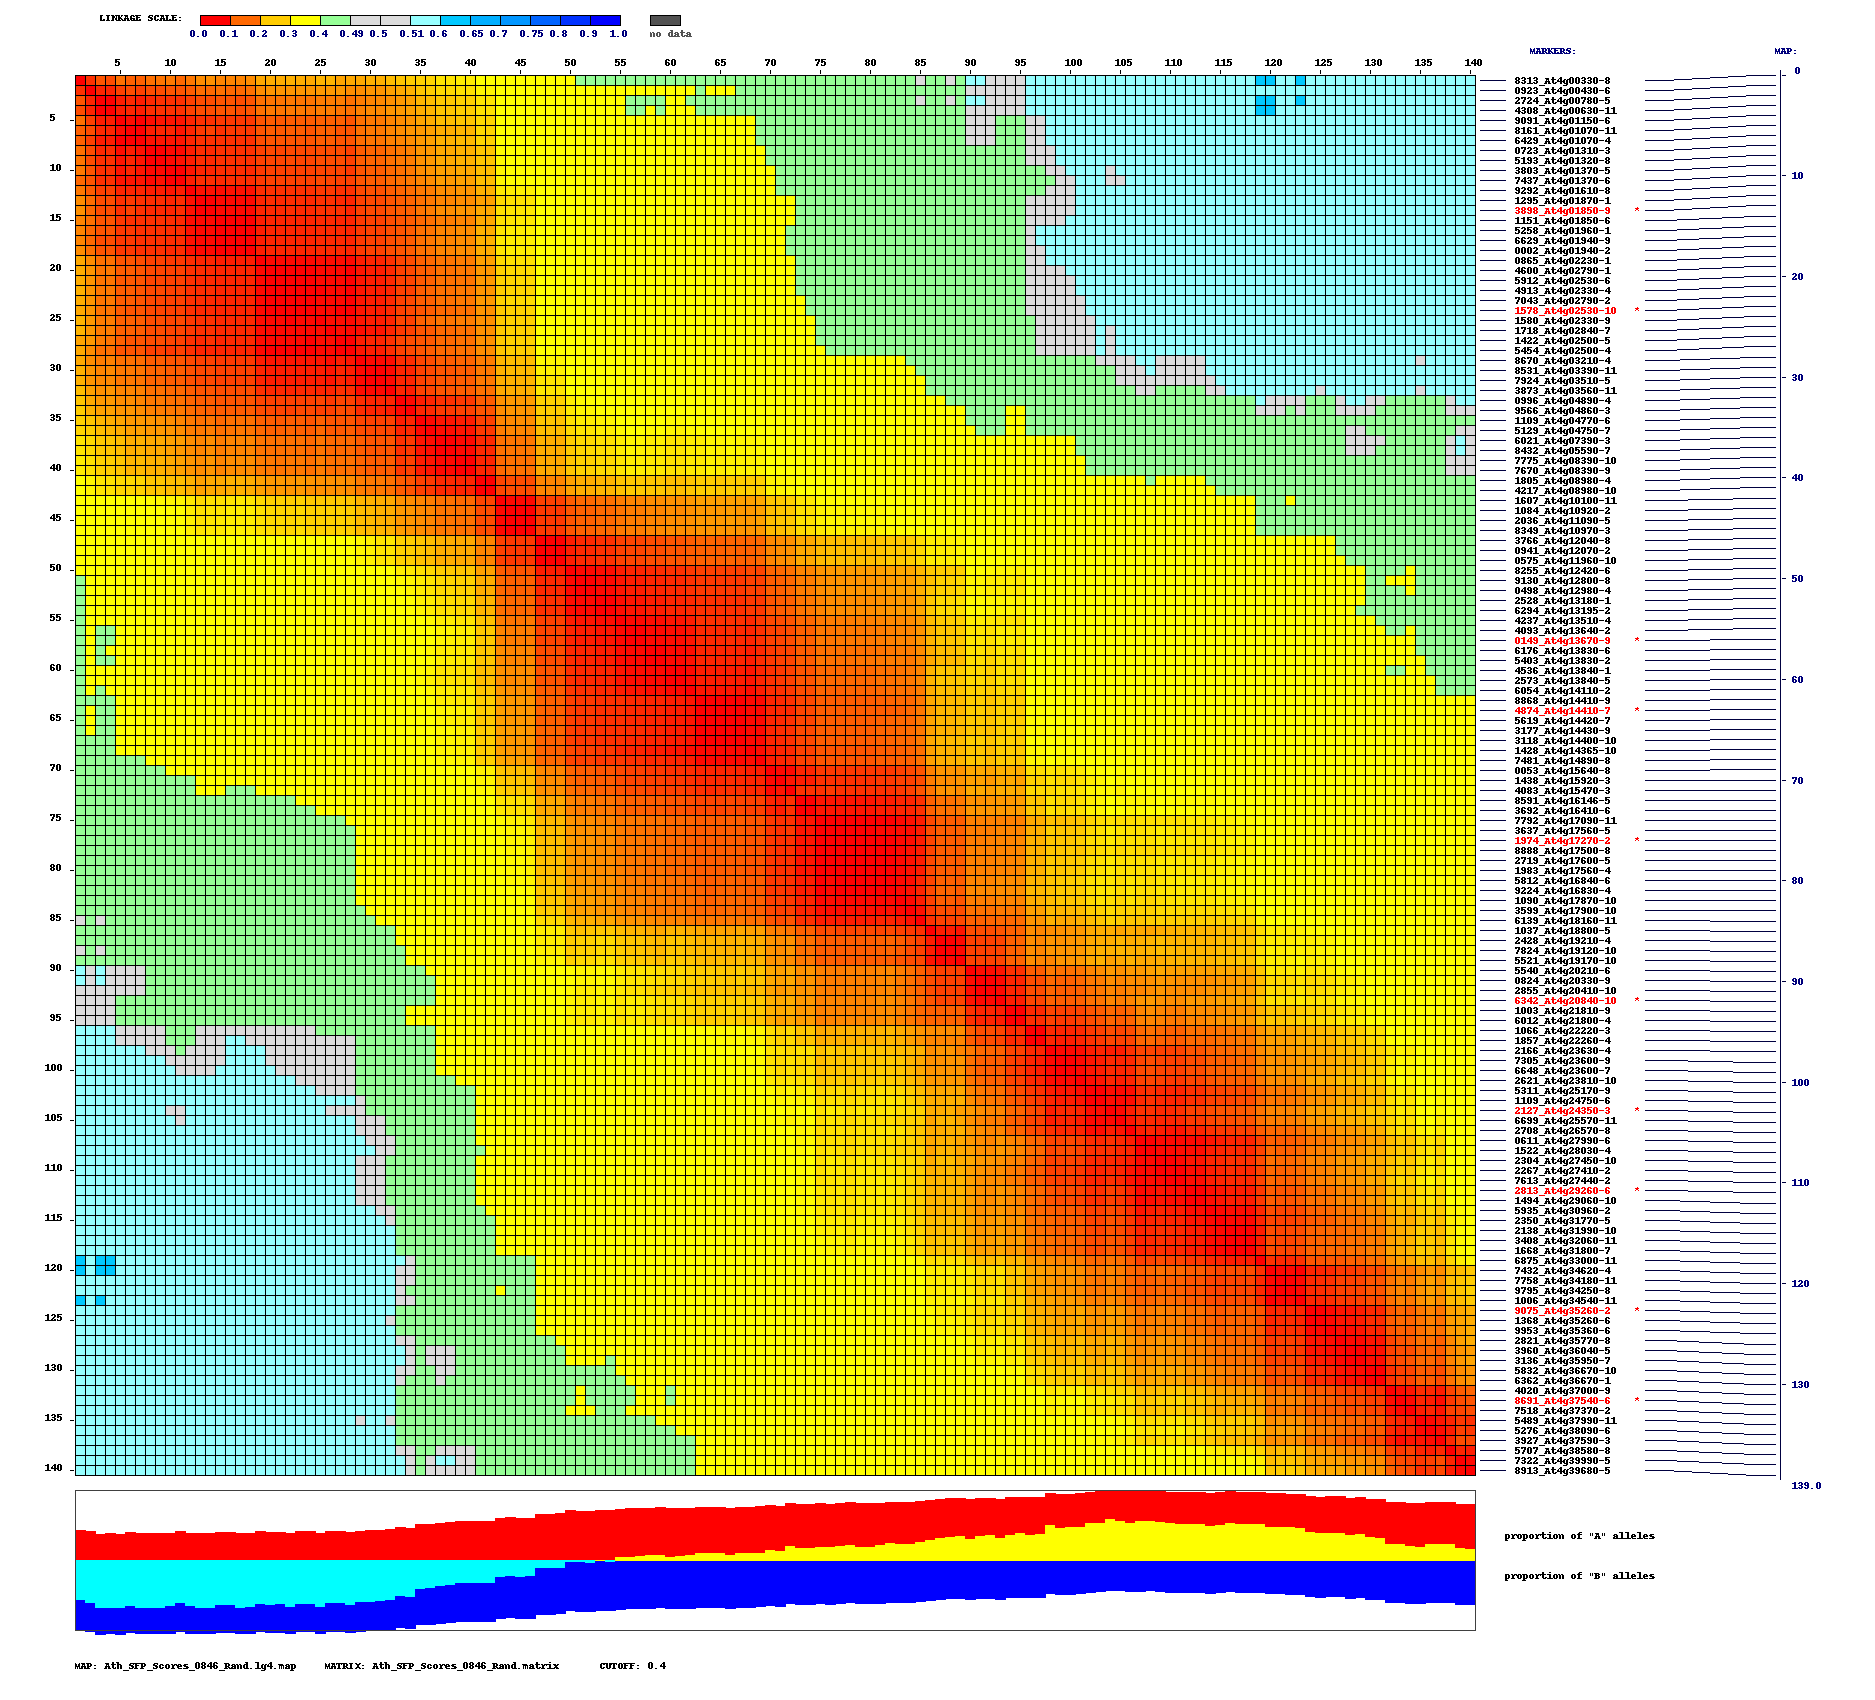
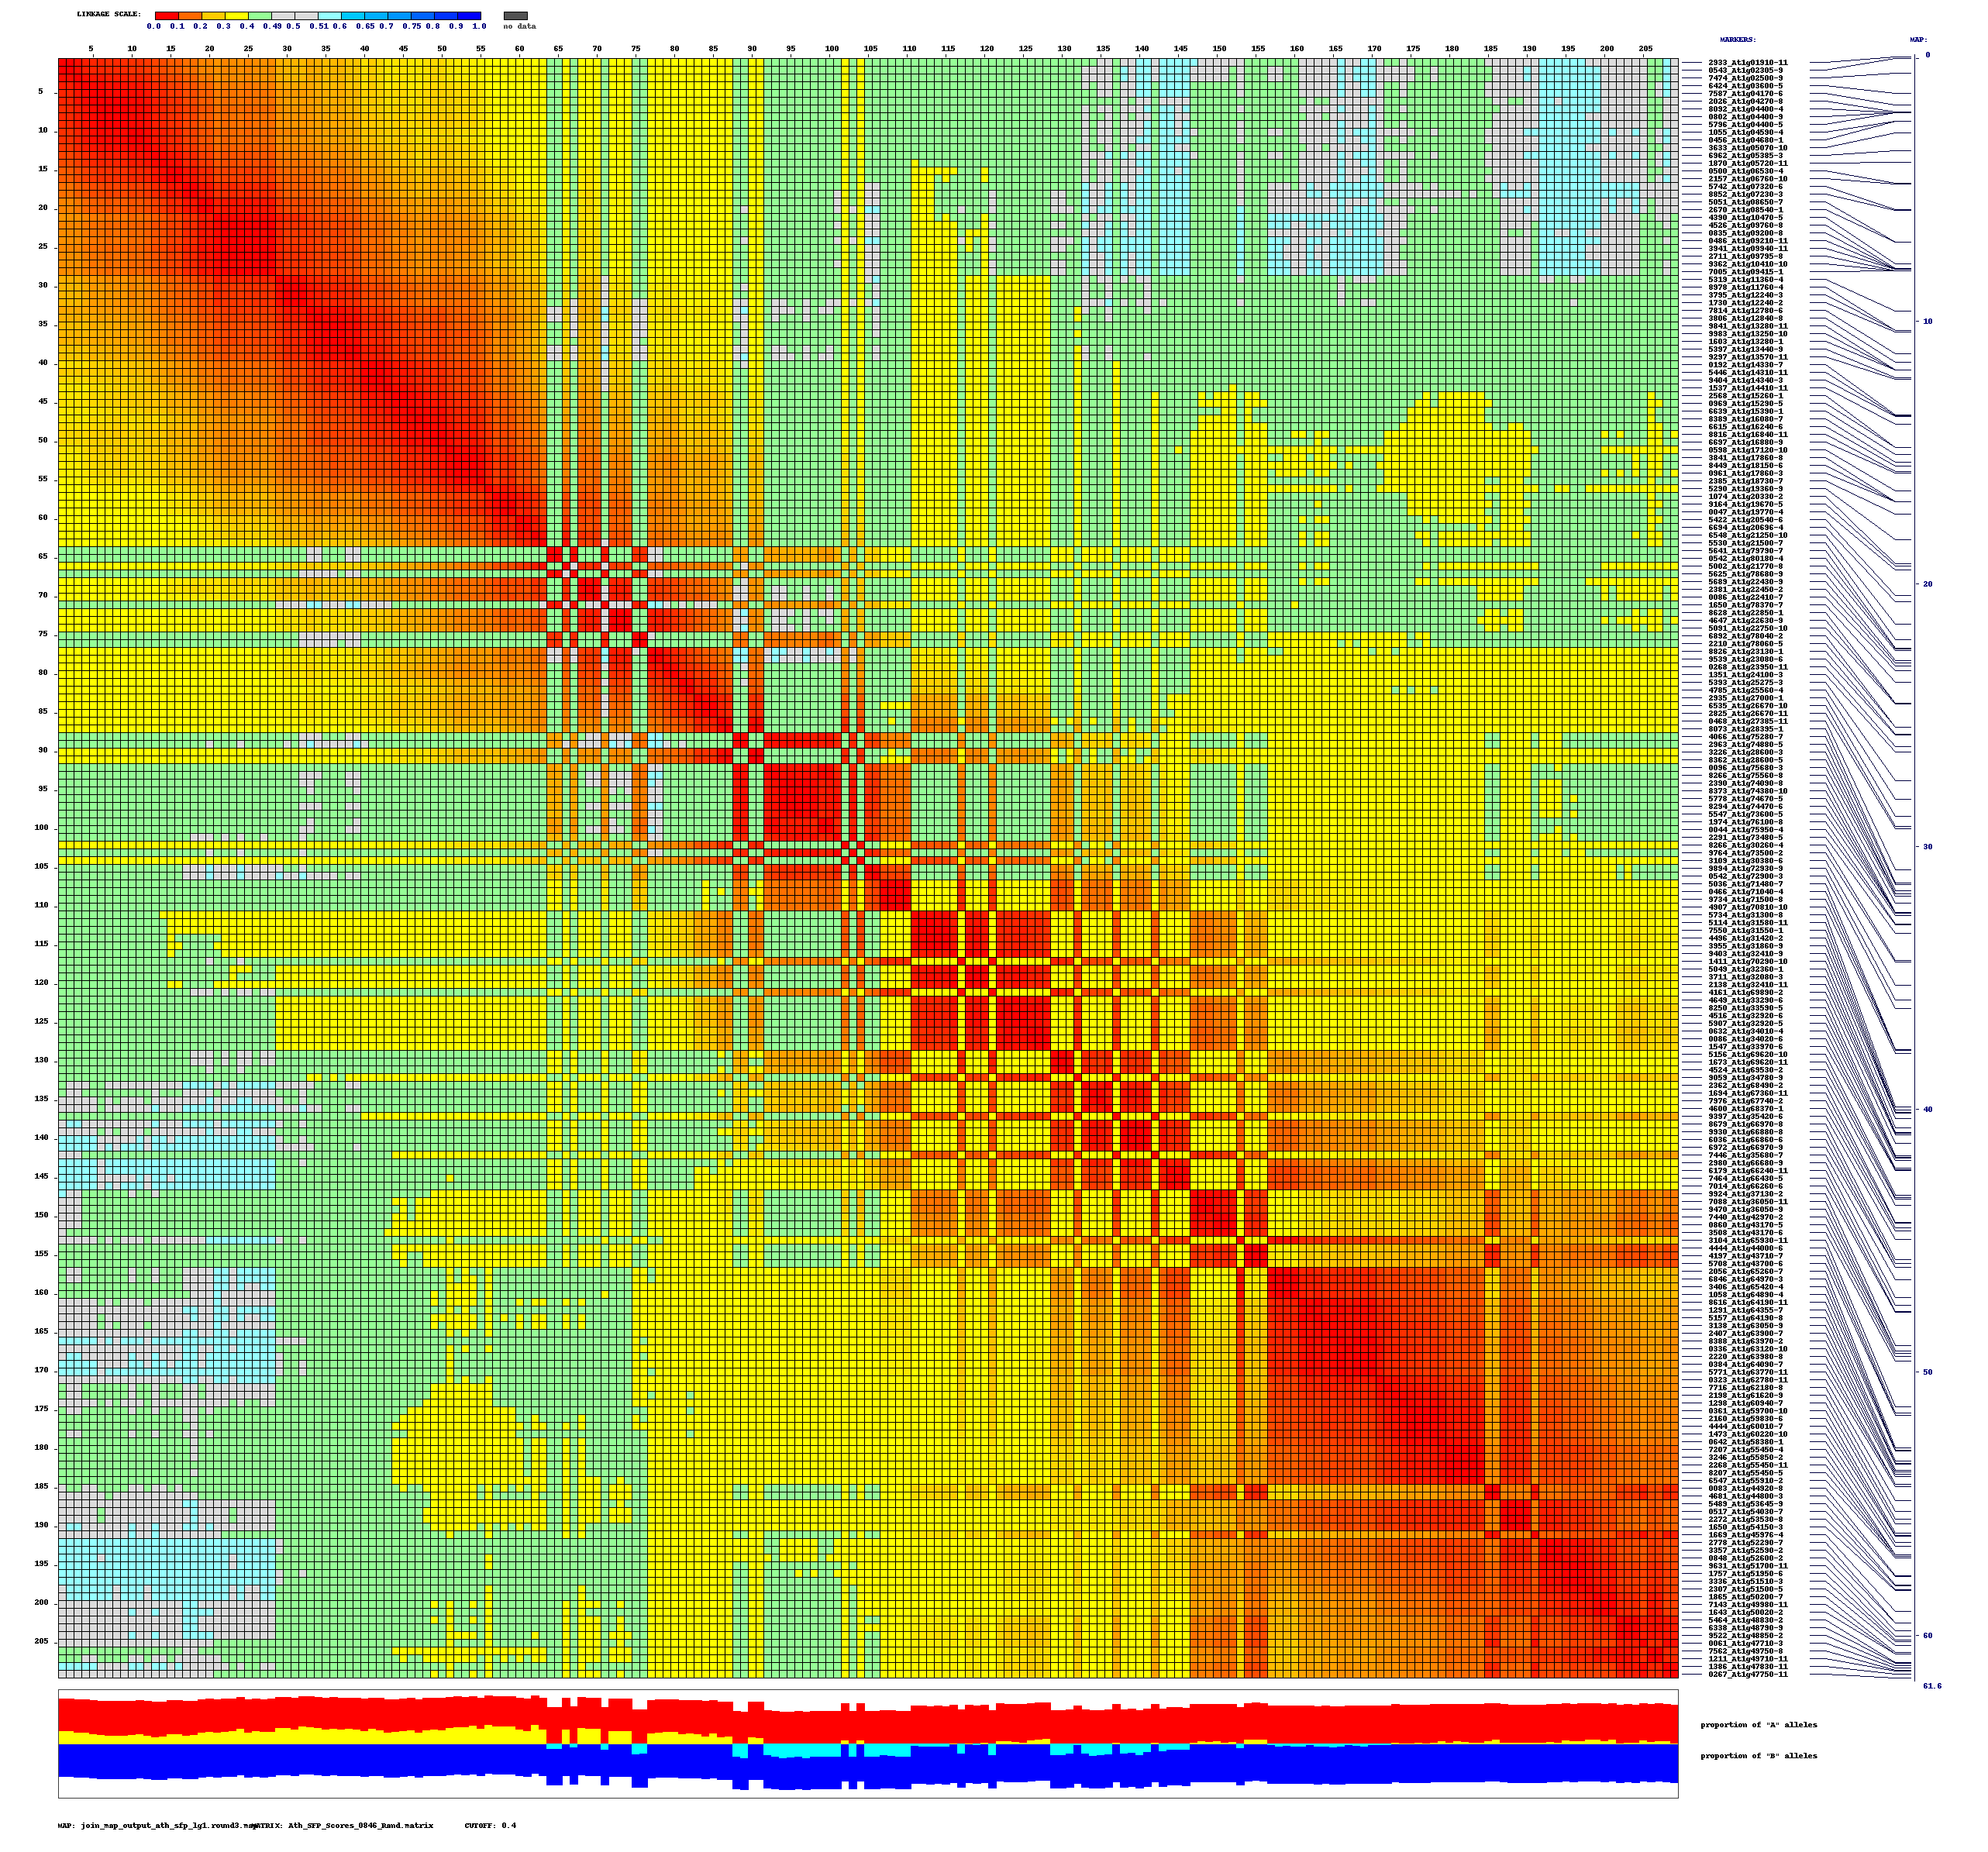
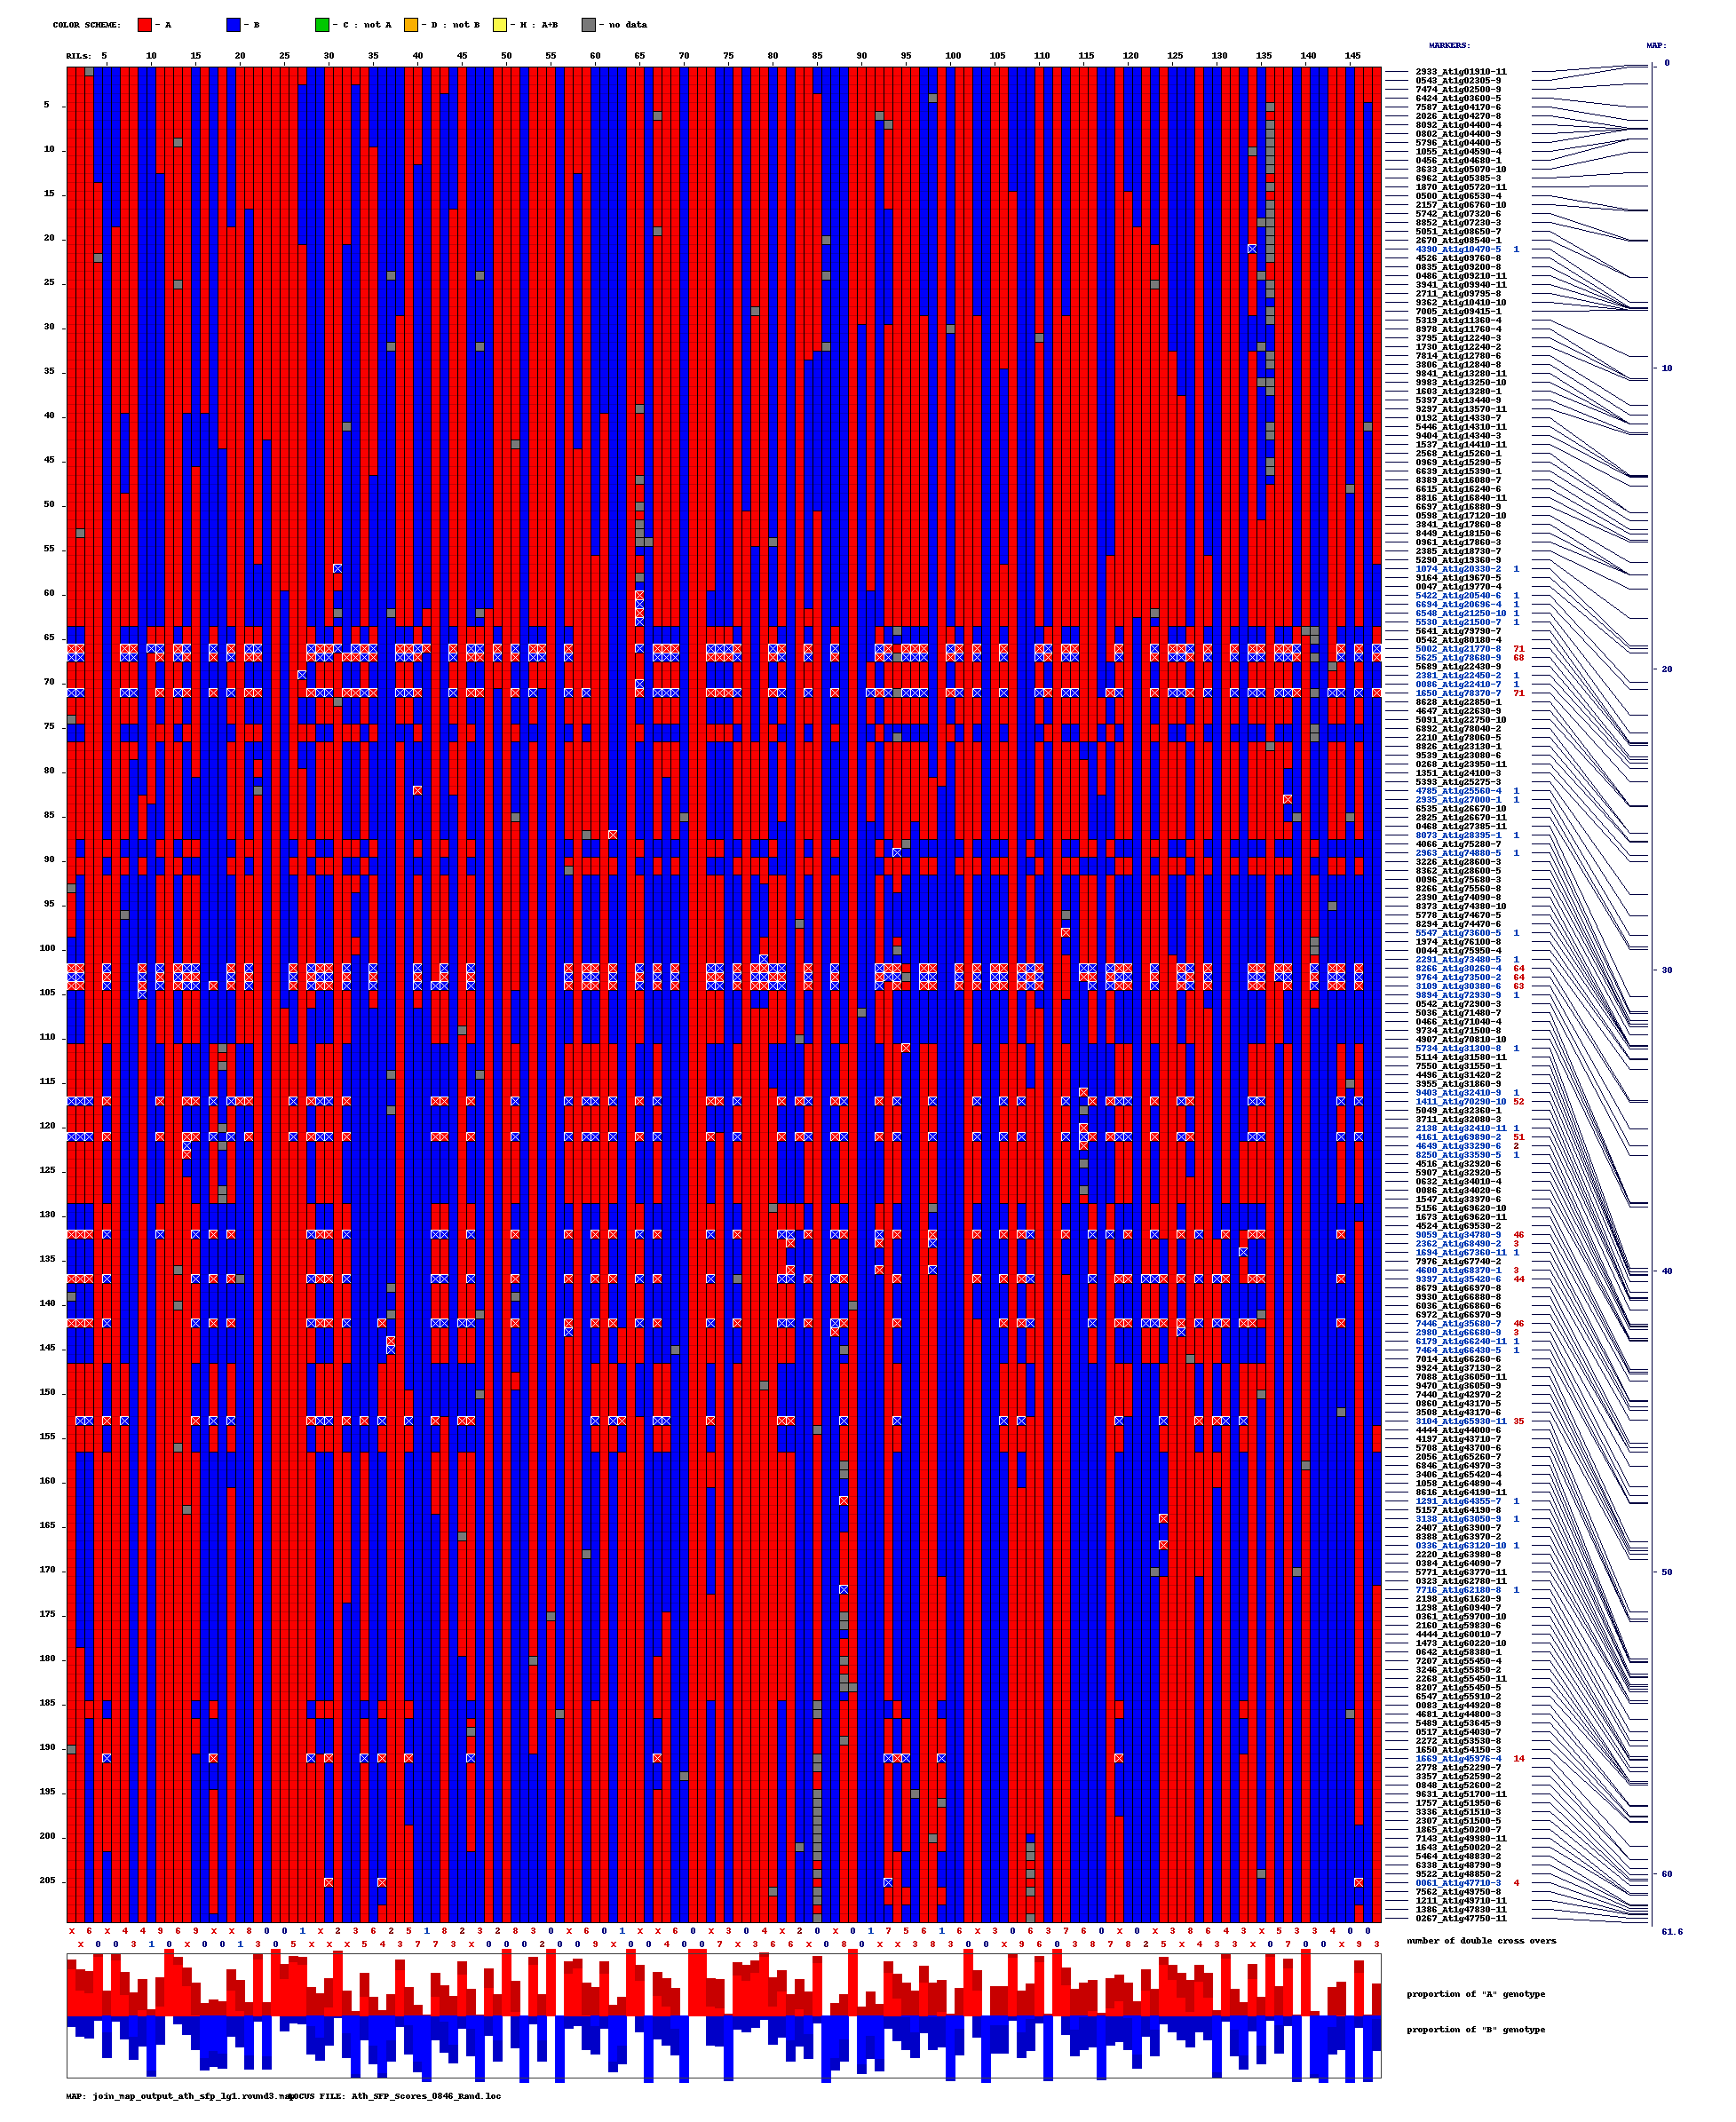
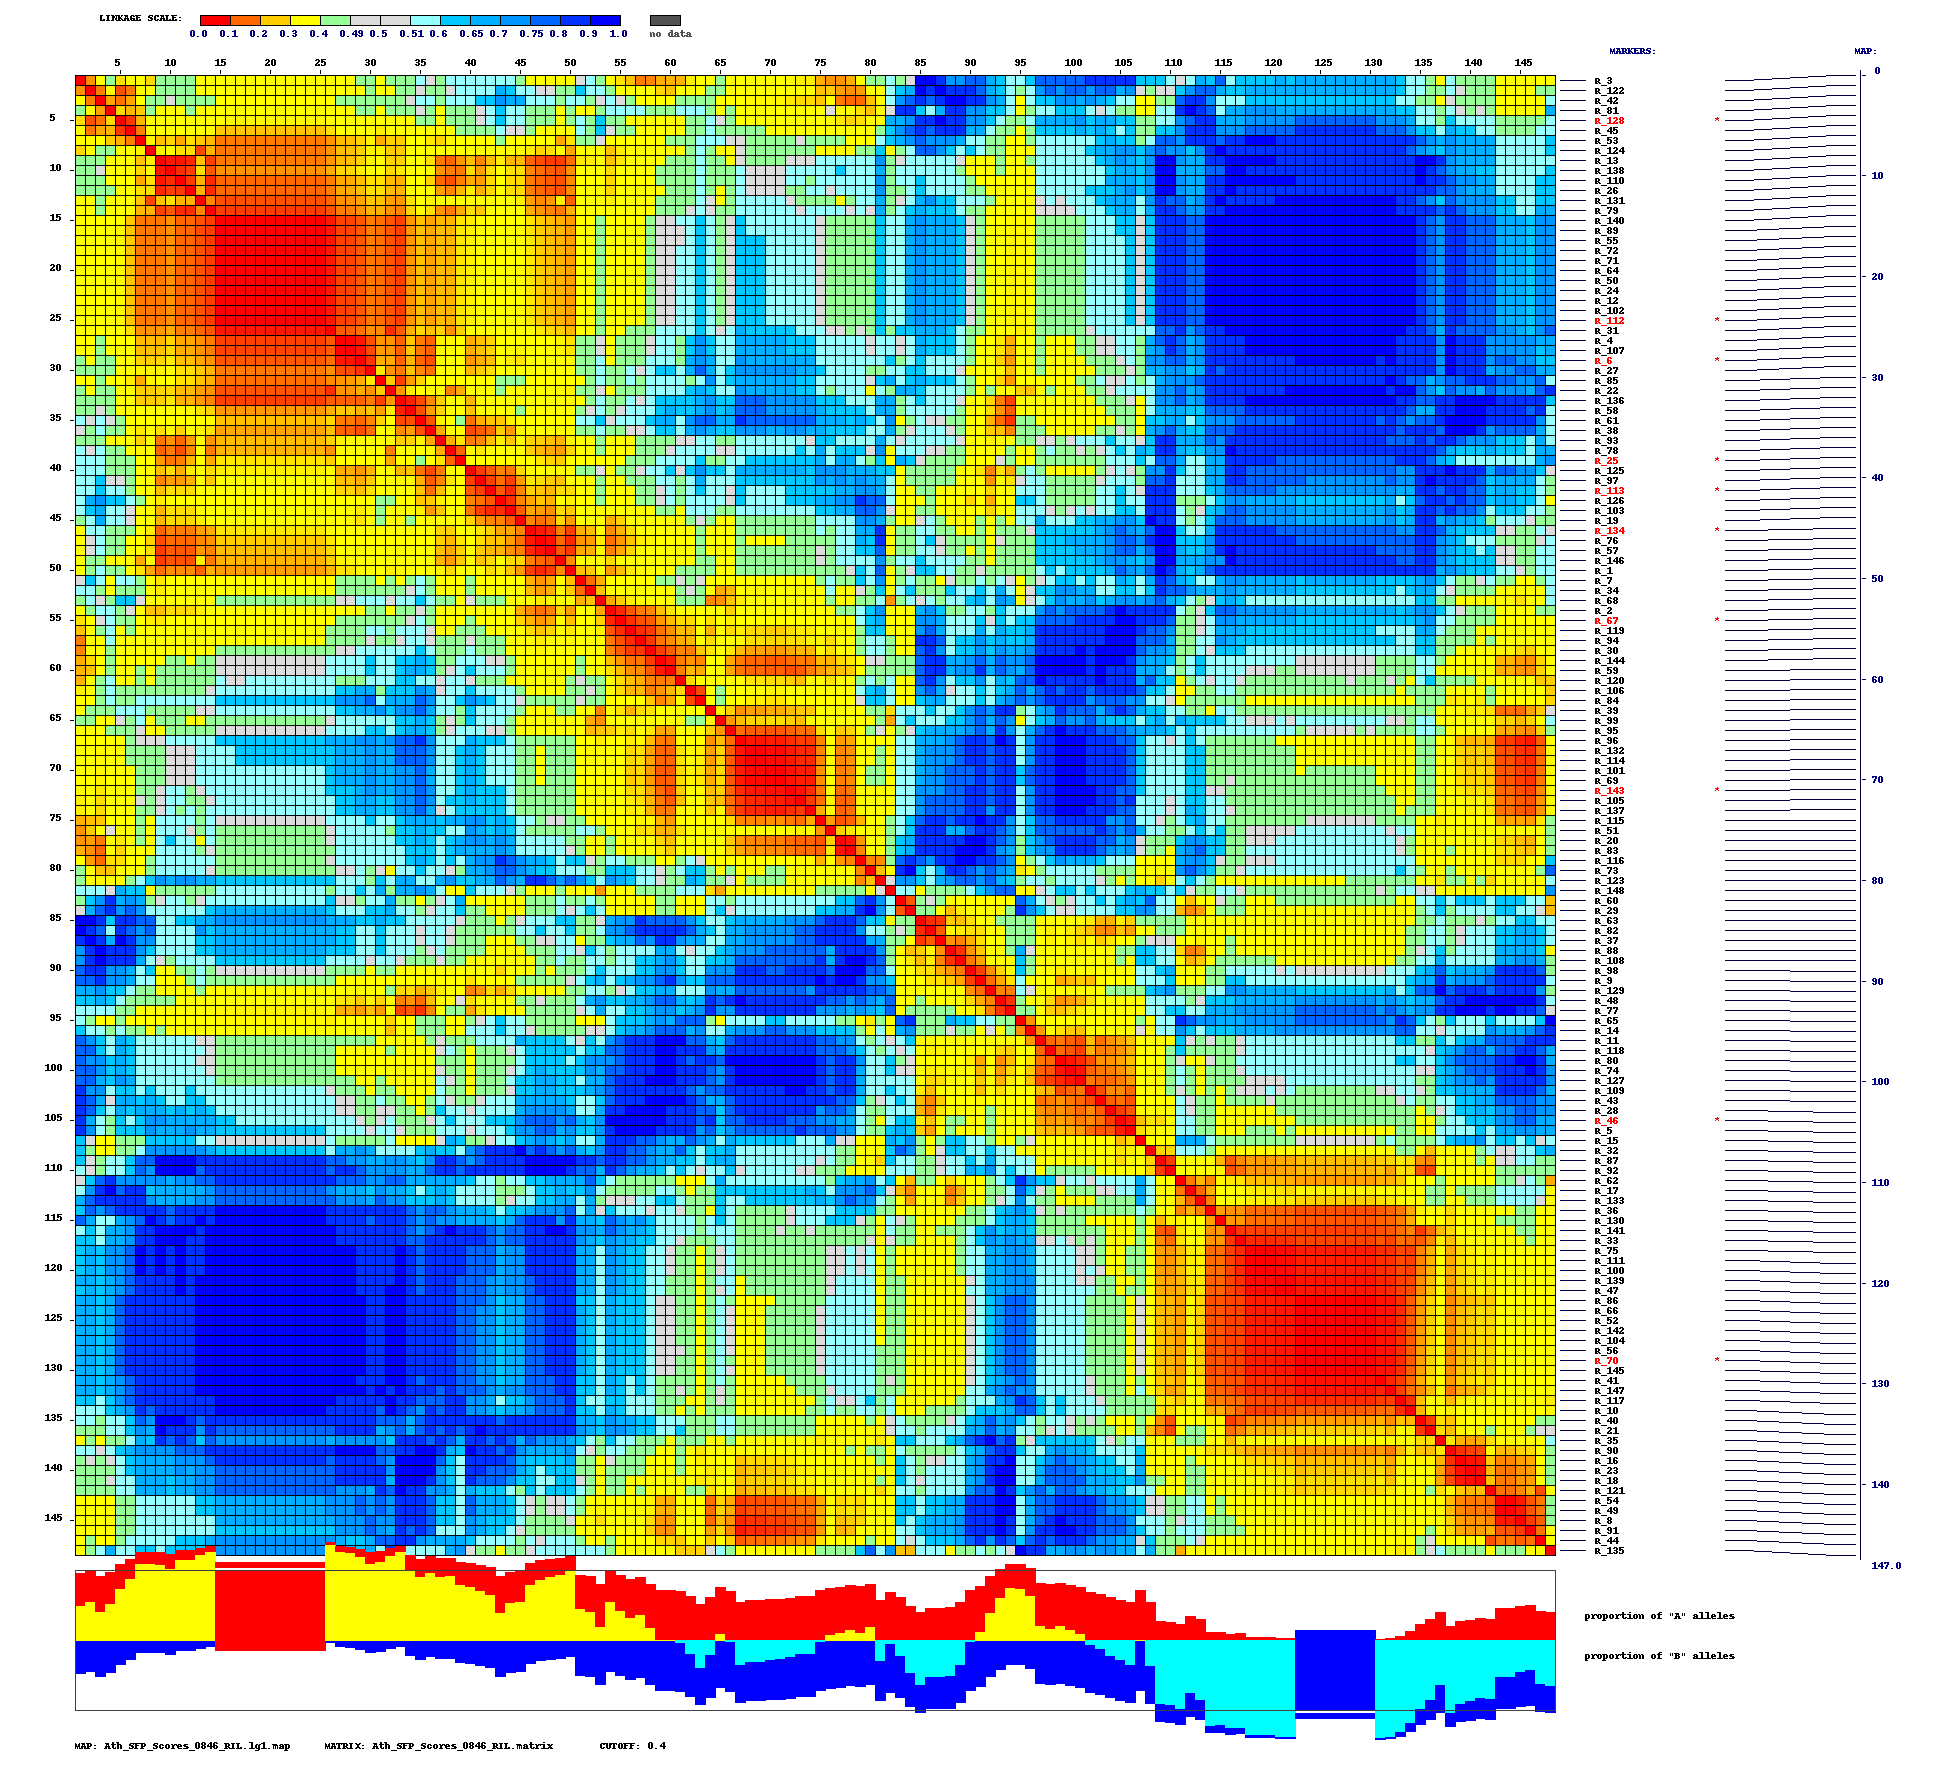
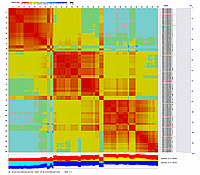
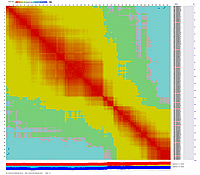
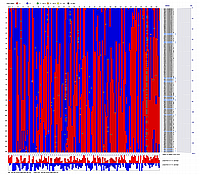
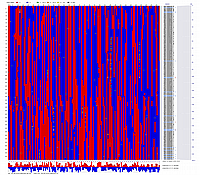
After visualization of grouping by CheckMatrix ten framework markers per linkage group were selected
(framework marker IDs are highlighted in red on the right side on two dimensional heat-plots):
Linkage Group I
|
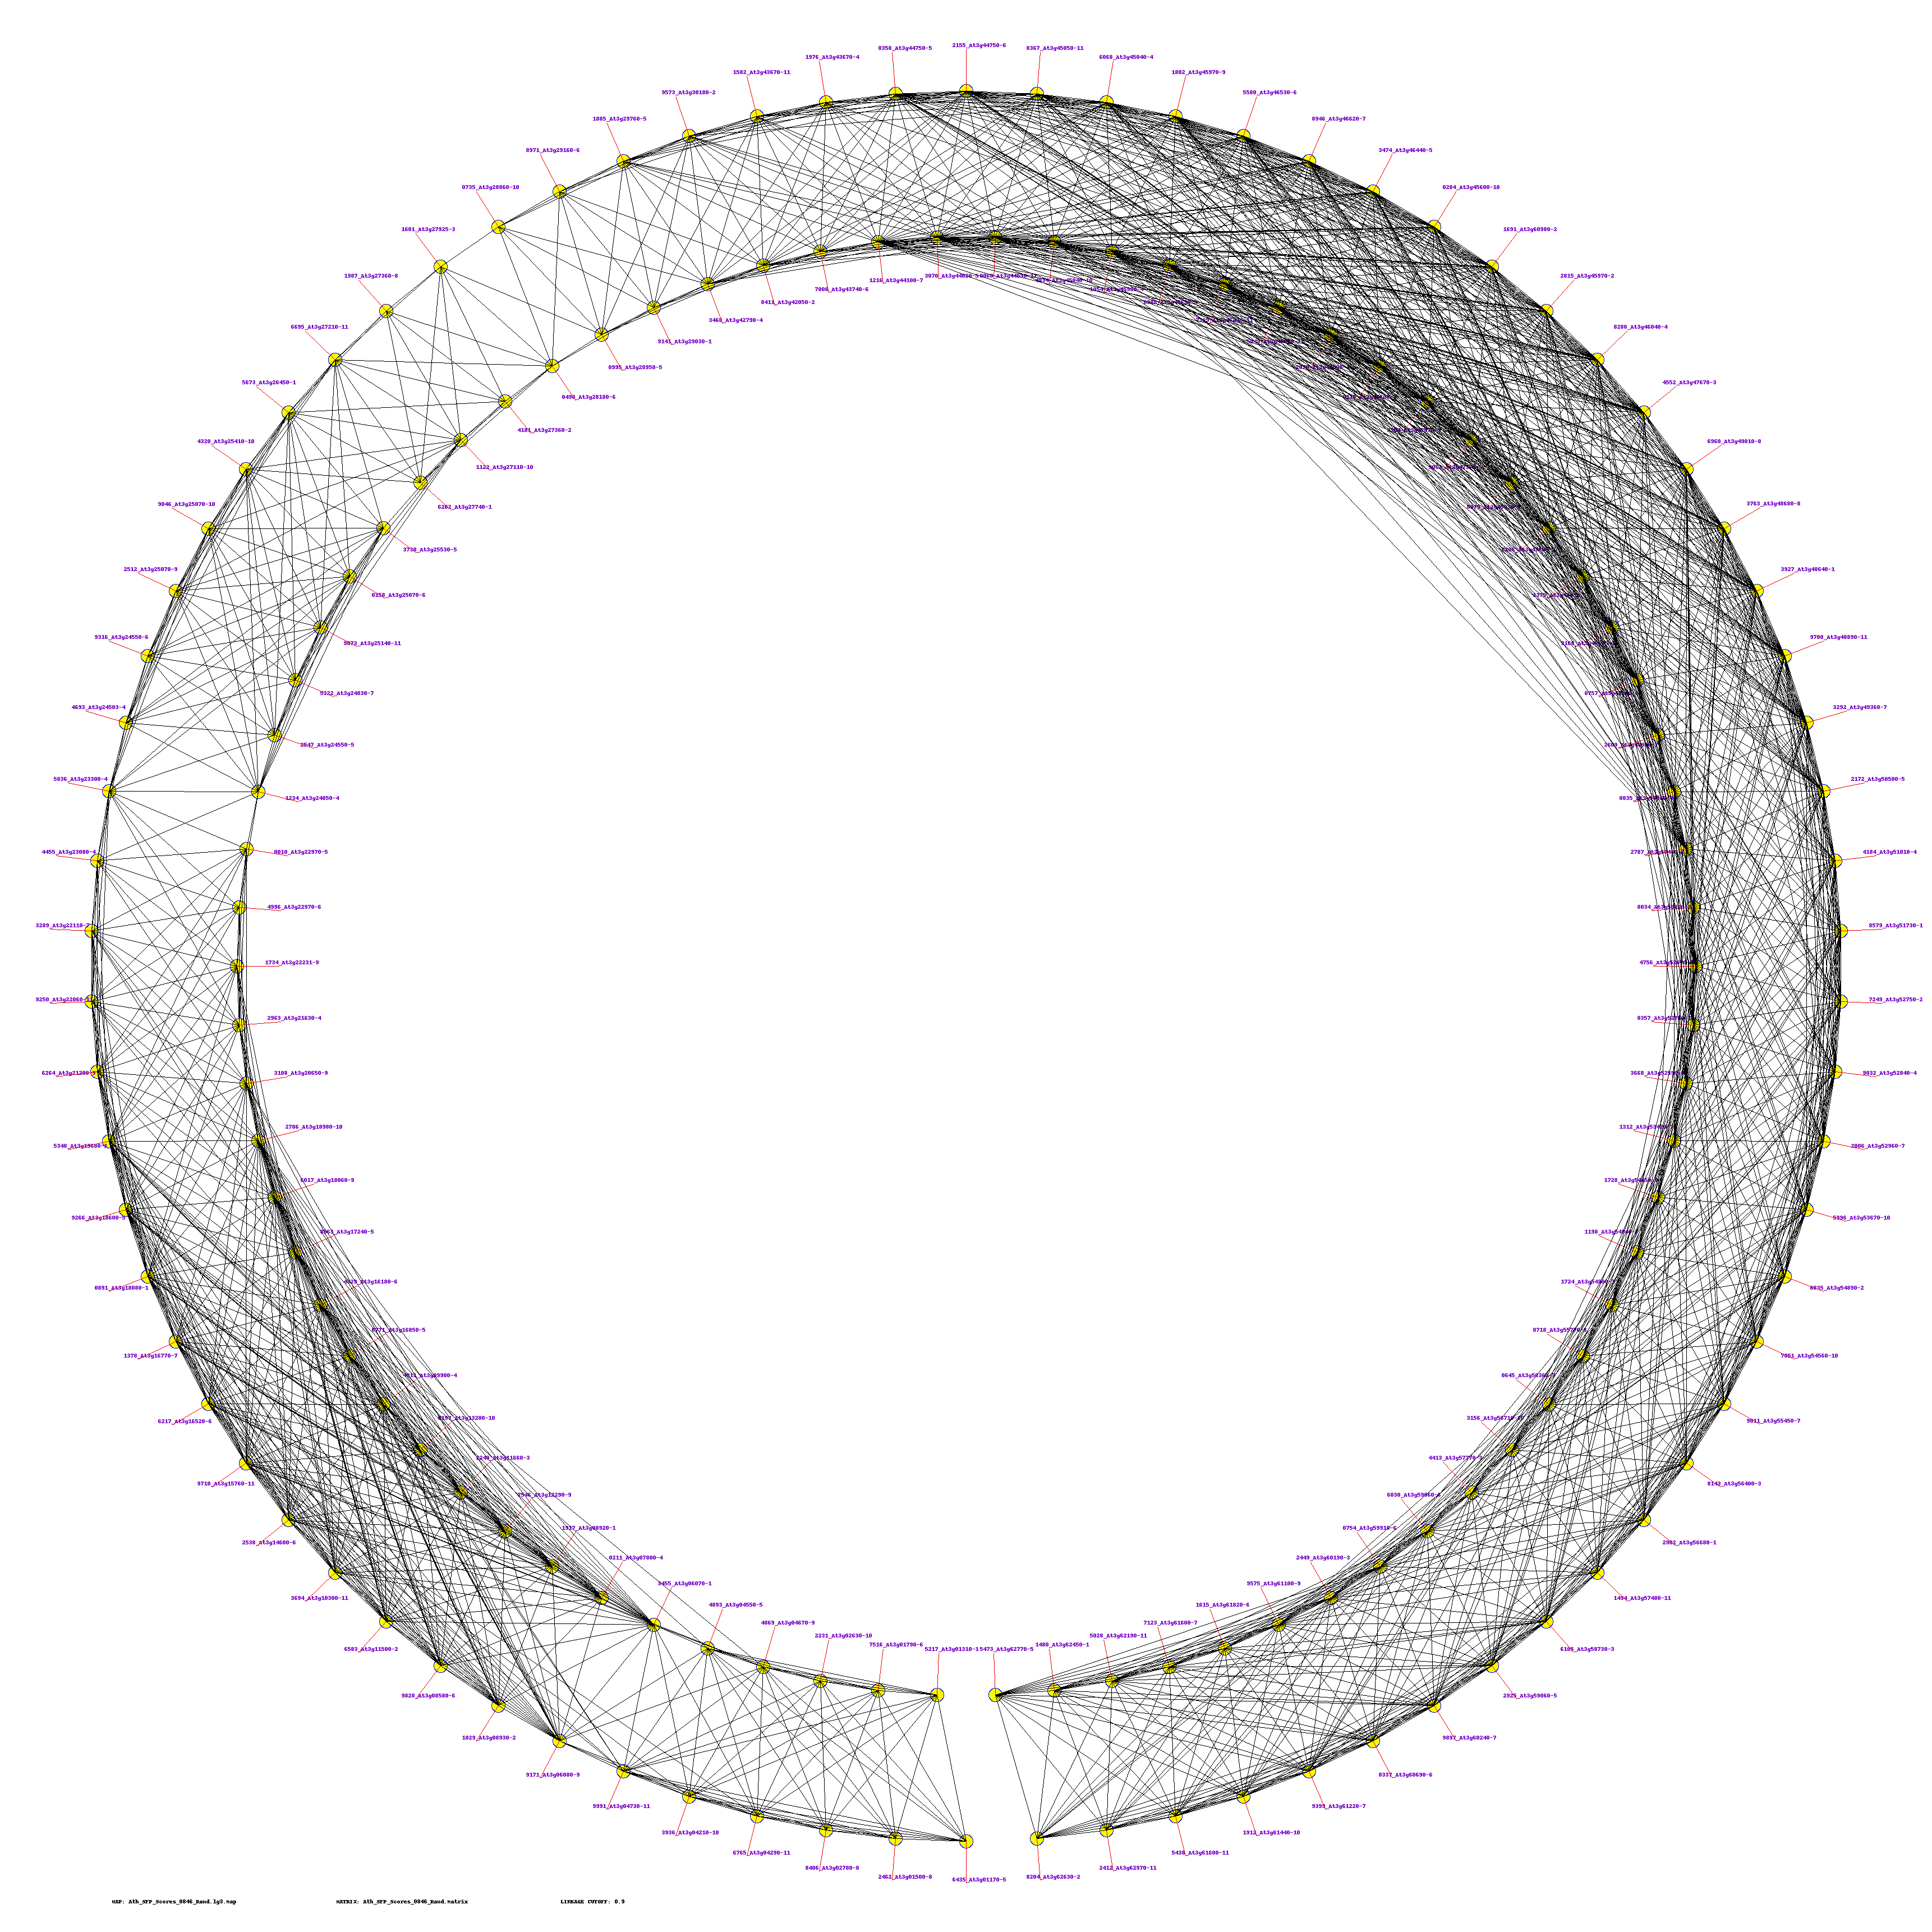
Linkage Group II
|
Linkage Group III
|
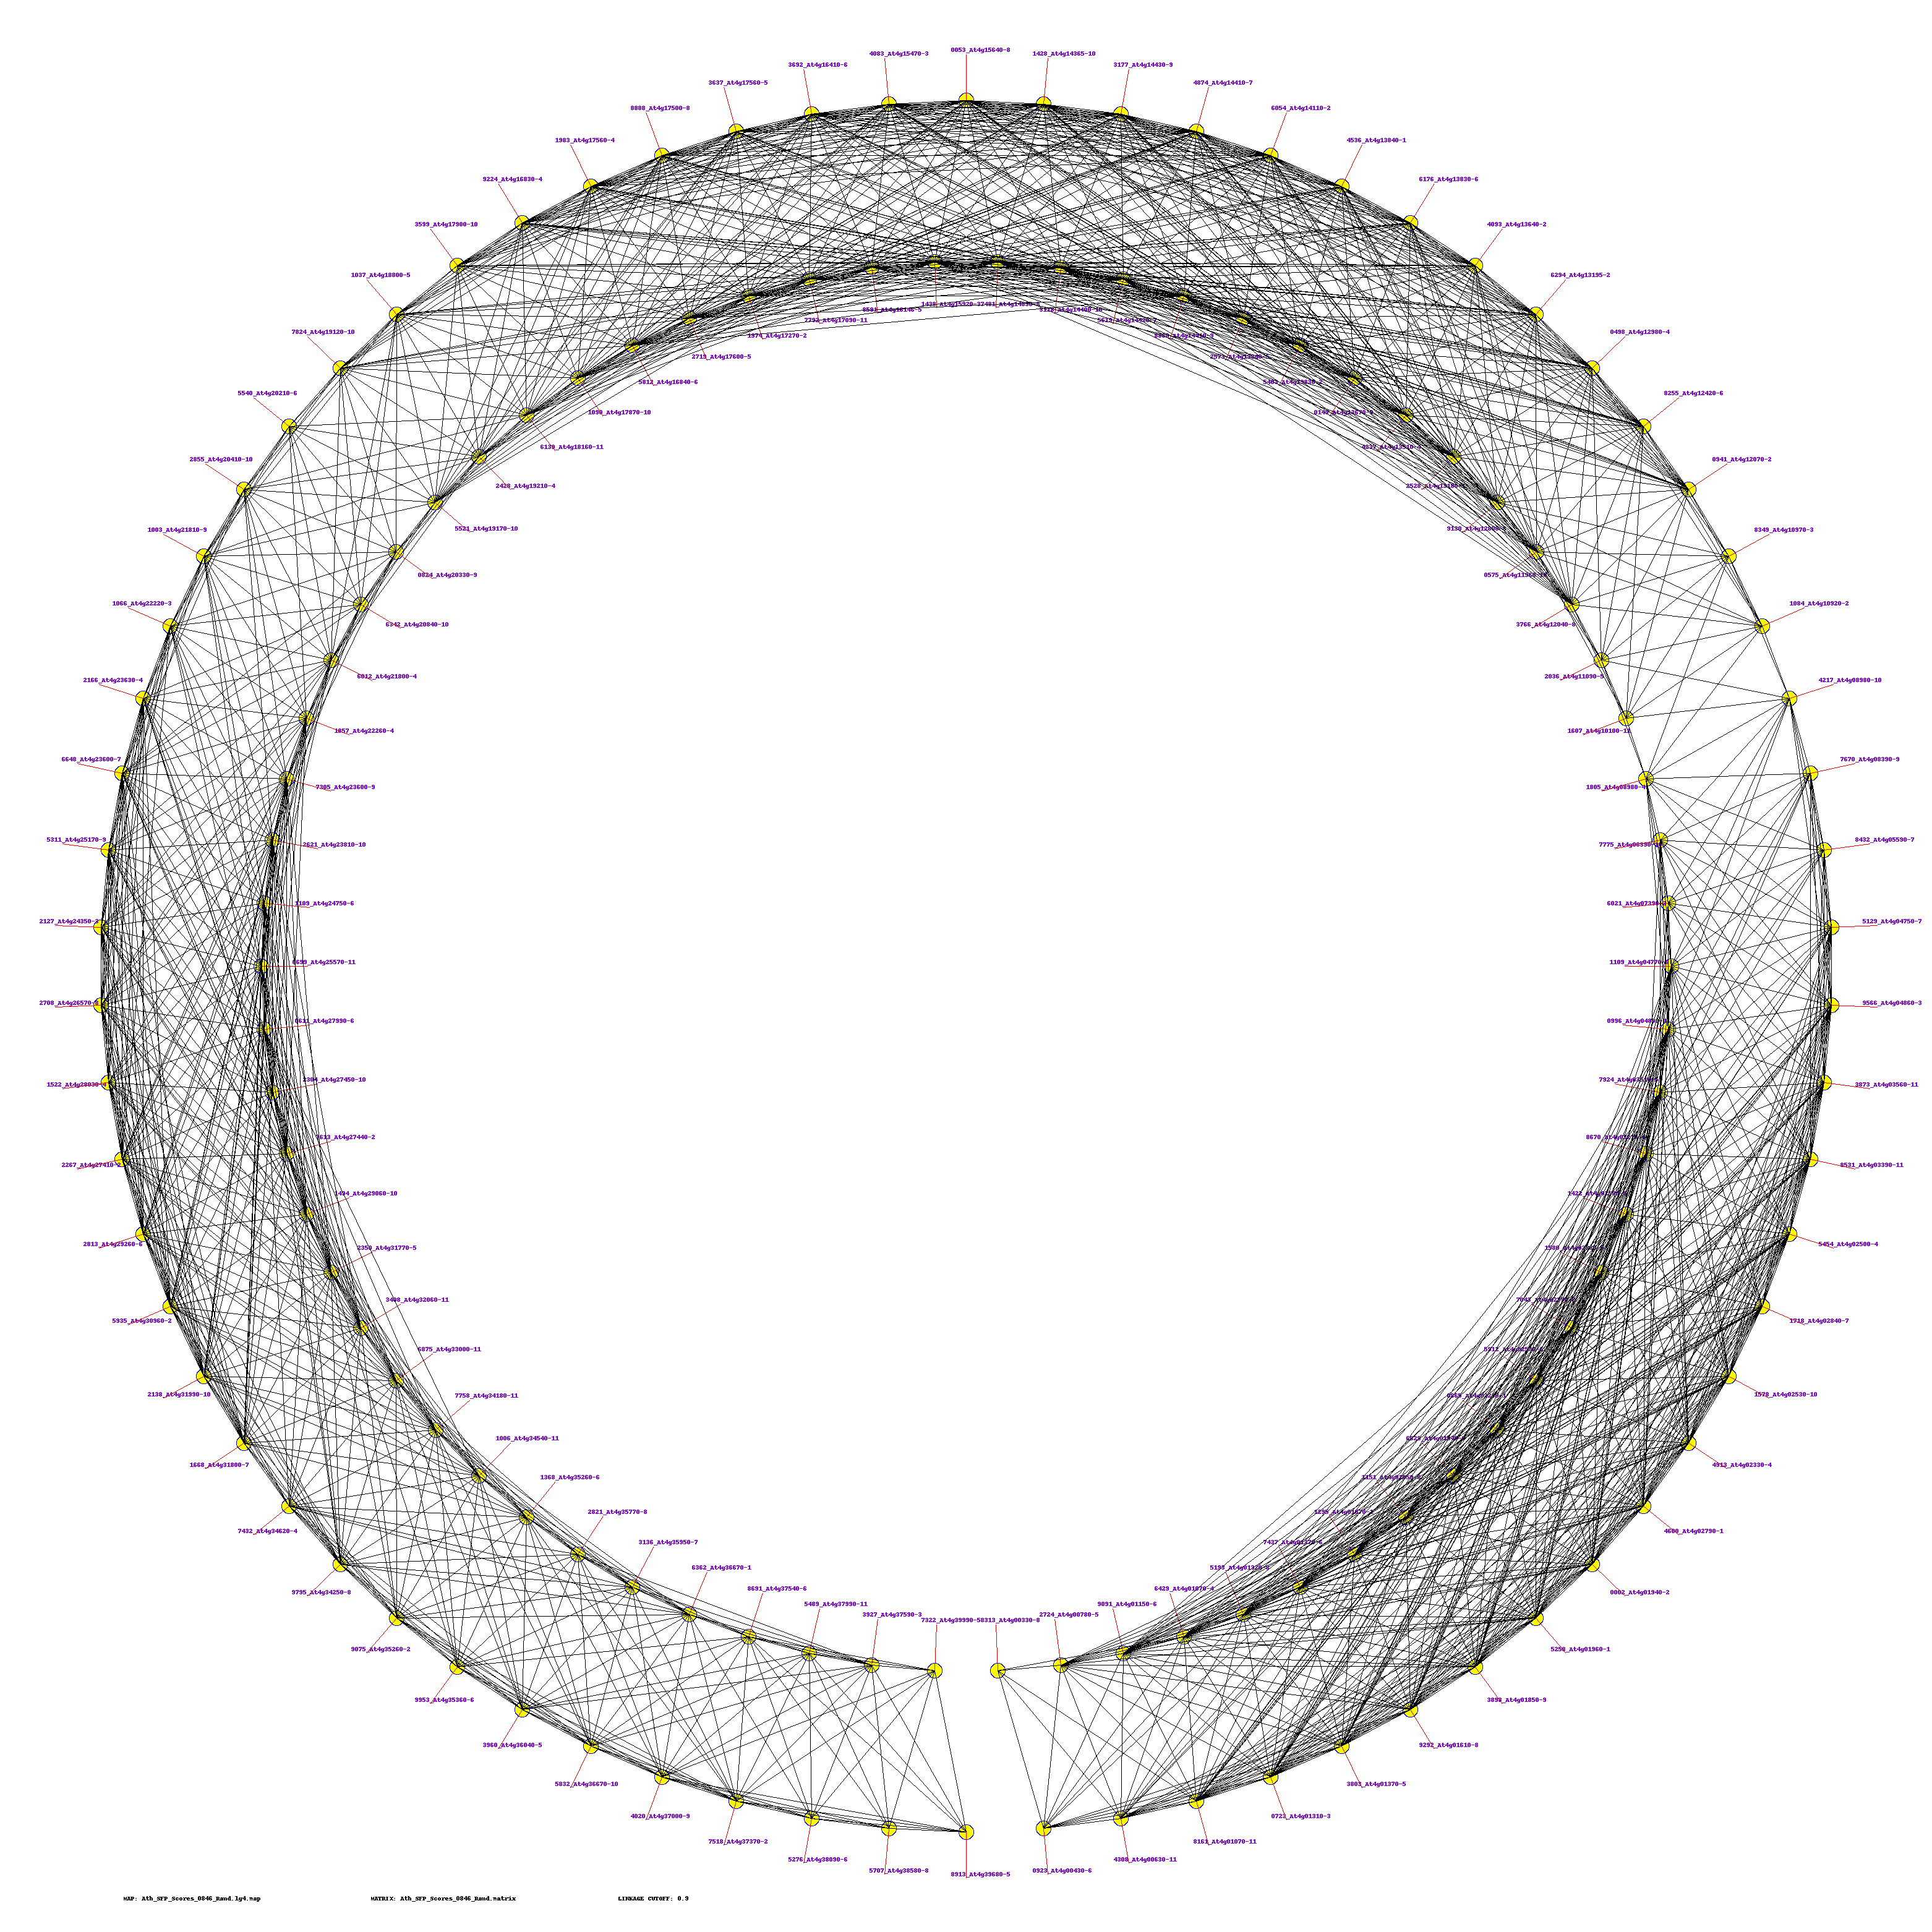
Linkage Group IV
|
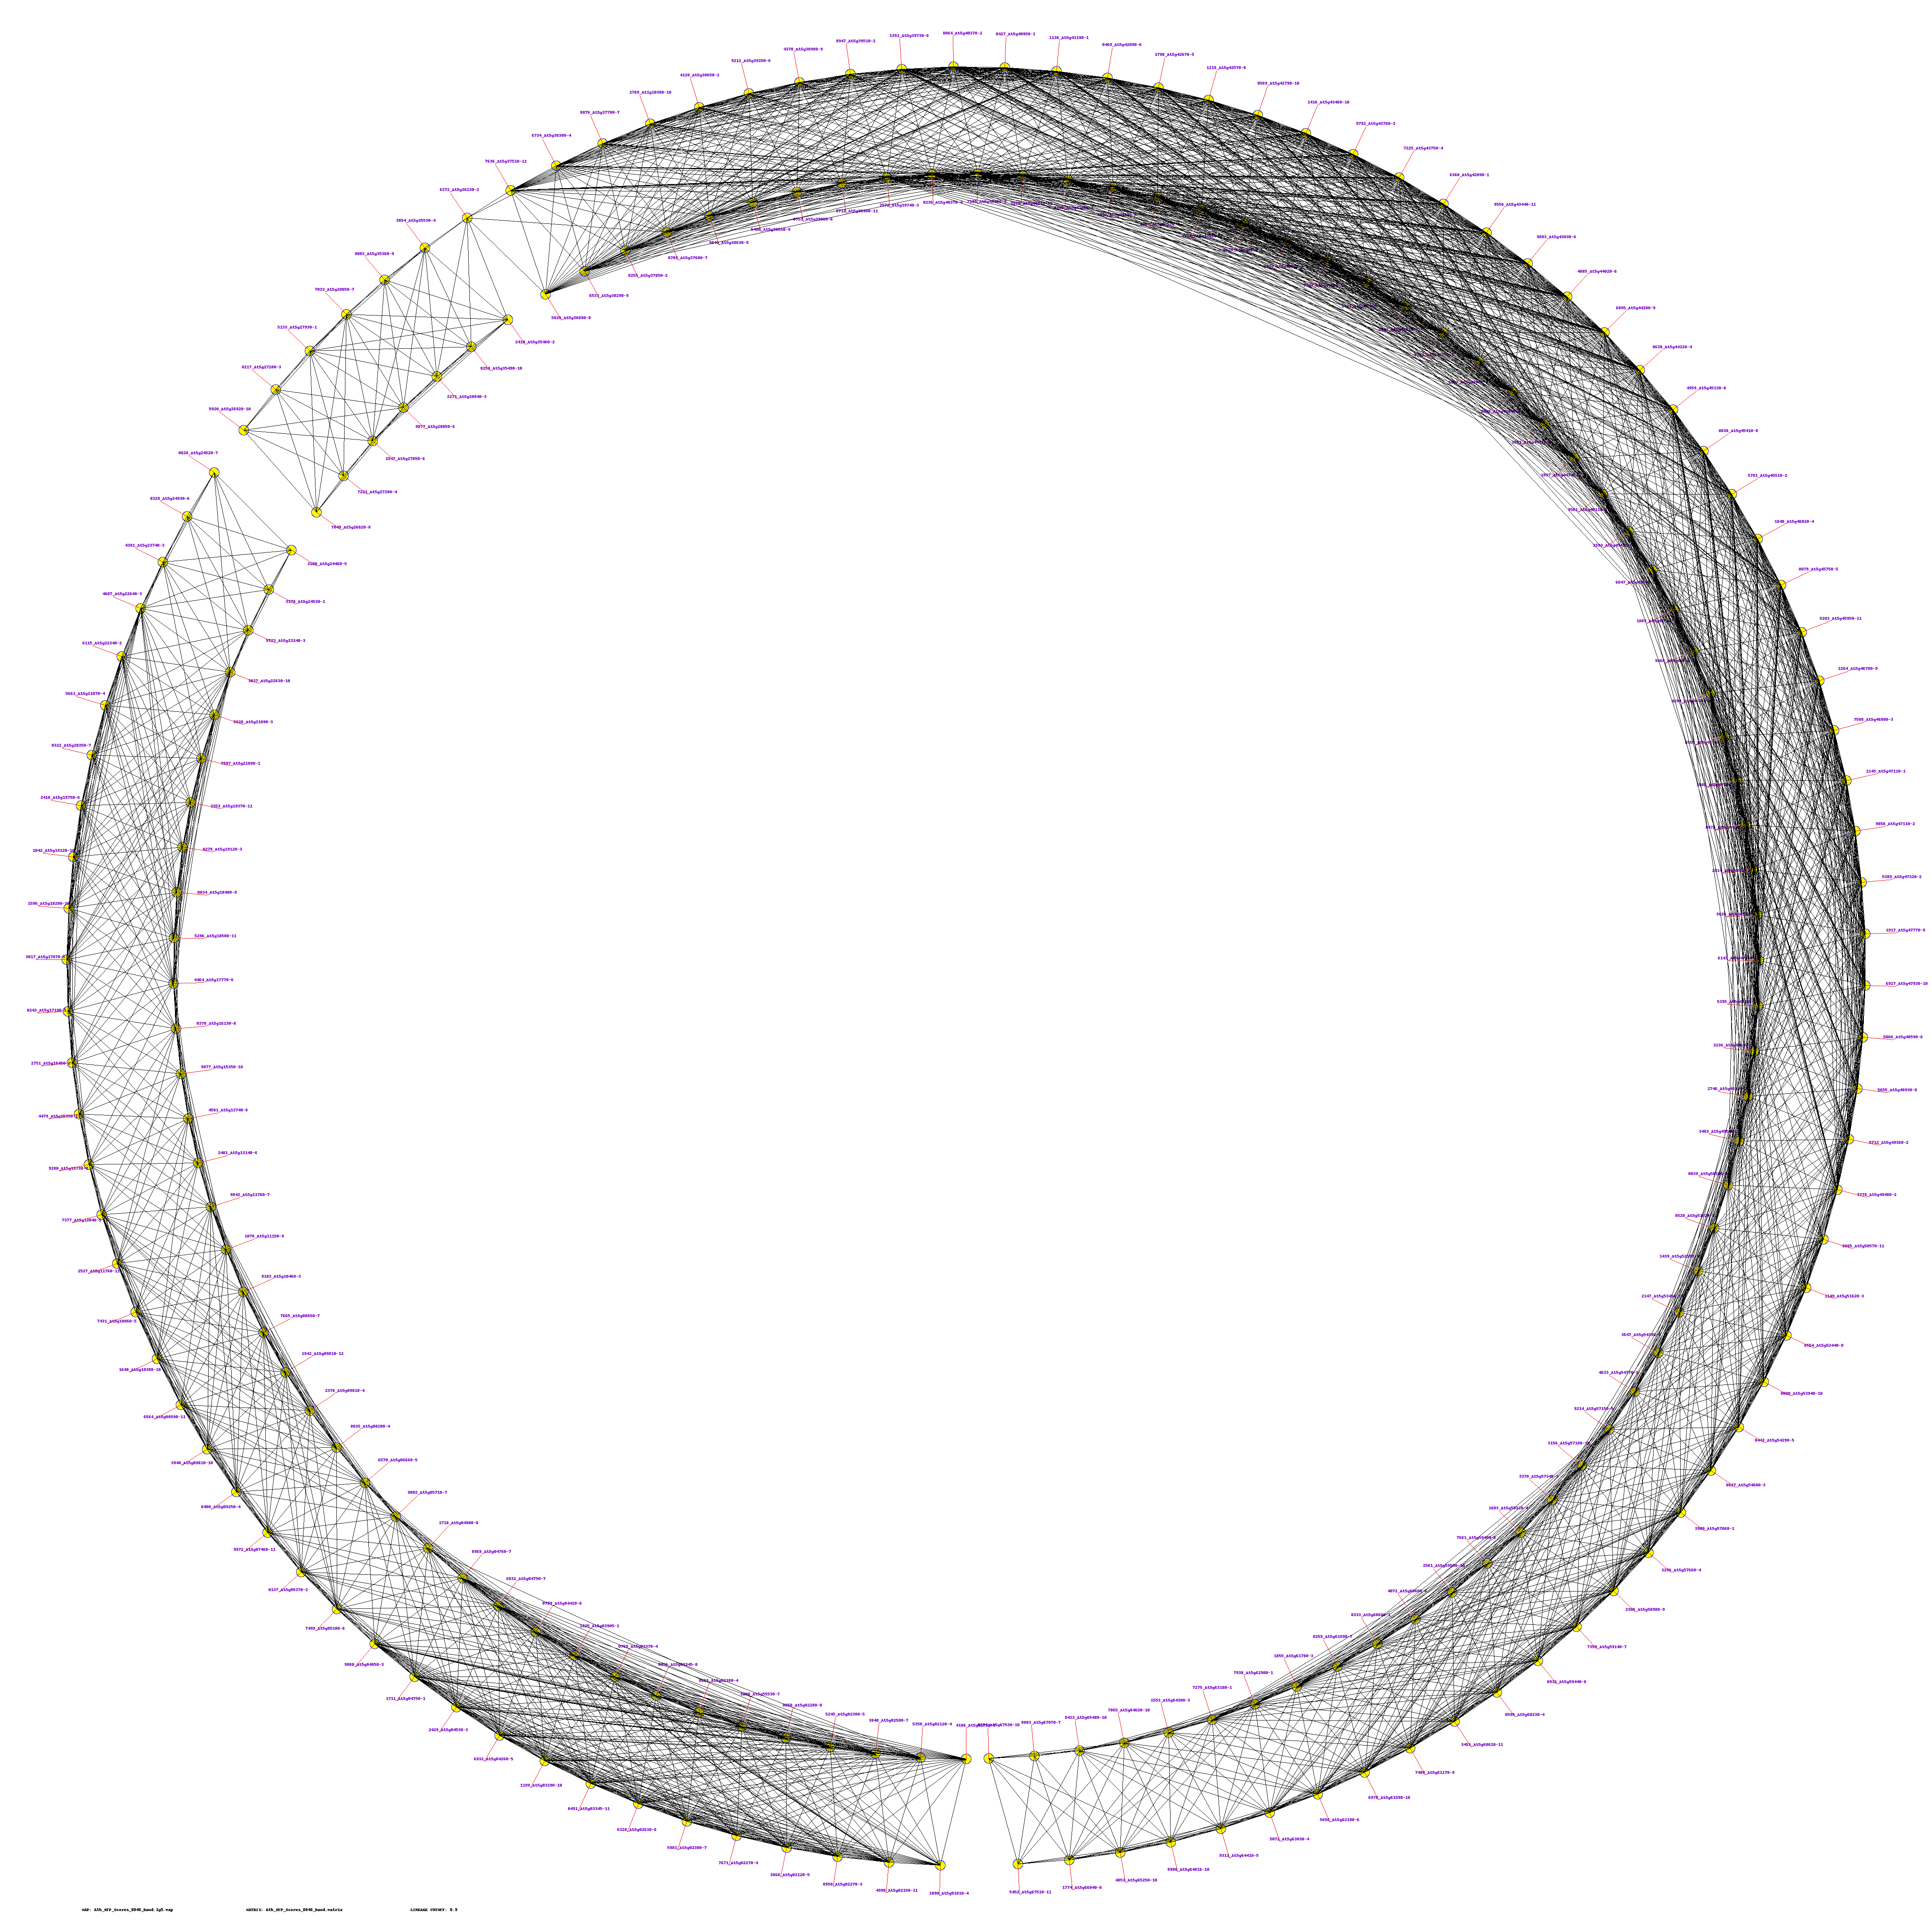
Linkage Group V
|
STEP 4: MAP CONSTRUCTION
for each list of markers to map:
Linkage Group I: Ath_SFP_Scores_0846_Rand.lg1.list.sorted
Linkage Group II: Ath_SFP_Scores_0846_Rand.lg2.list.sorted
Linkage Group III: Ath_SFP_Scores_0846_Rand.lg3.list.sorted
Linkage Group IV: Ath_SFP_Scores_0846_Rand.lg4.list.sorted
Linkage Group V: Ath_SFP_Scores_0846_Rand.lg5.list.sorted
(note, that markers are randomly ordered according to their prefixes)
and list of framework markers:
Linkage Group I: Ath_SFP_Scores_0846_Rand.lg1.frame
Linkage Group II: Ath_SFP_Scores_0846_Rand.lg2.frame
Linkage Group III: Ath_SFP_Scores_0846_Rand.lg3.frame
Linkage Group IV: Ath_SFP_Scores_0846_Rand.lg4.frame
Linkage Group V: Ath_SFP_Scores_0846_Rand.lg5.frame
run Python_MadMapper_V248_XDELTA_115.py with following options:
python Python_MadMapper_V248_XDELTA_115.py Ath_SFP_Scores_0846_Rand.recbit02.pairs_all Ath_SFP_Scores_0846_Rand.lg1.list.sorted Ath_SFP_Scores_0846_Rand.lg1.frame Ath_SFP_Scores_0846_Rand.lg1.xdeltaV115_6_3_MS.out 1 FLEX SHUFFLE 6 3
five output files (maps) are listed here:
Linkage Group I: Ath_SFP_Scores_0846_Rand.lg1.xdeltaV115_6_3_MS.out.mad_map_final
Linkage Group II: Ath_SFP_Scores_0846_Rand.lg2.xdeltaV115_6_3_MS.out.mad_map_final
Linkage Group III: Ath_SFP_Scores_0846_Rand.lg3.xdeltaV115_6_3_MS.out.mad_map_final
Linkage Group IV: Ath_SFP_Scores_0846_Rand.lg4.xdeltaV115_6_3_MS.out.mad_map_final
Linkage Group V: Ath_SFP_Scores_0846_Rand.lg5.xdeltaV115_6_3_MS.out.mad_map_final
all temporary maps were recorded into '*.mad_map_temp' files:
Linkage Group I: Ath_SFP_Scores_0846_Rand.lg1.xdeltaV115_6_3_MS.out.mad_map_temp
Linkage Group II: Ath_SFP_Scores_0846_Rand.lg2.xdeltaV115_6_3_MS.out.mad_map_temp
Linkage Group III: Ath_SFP_Scores_0846_Rand.lg3.xdeltaV115_6_3_MS.out.mad_map_temp
Linkage Group IV: Ath_SFP_Scores_0846_Rand.lg4.xdeltaV115_6_3_MS.out.mad_map_temp
Linkage Group V: Ath_SFP_Scores_0846_Rand.lg5.xdeltaV115_6_3_MS.out.mad_map_temp
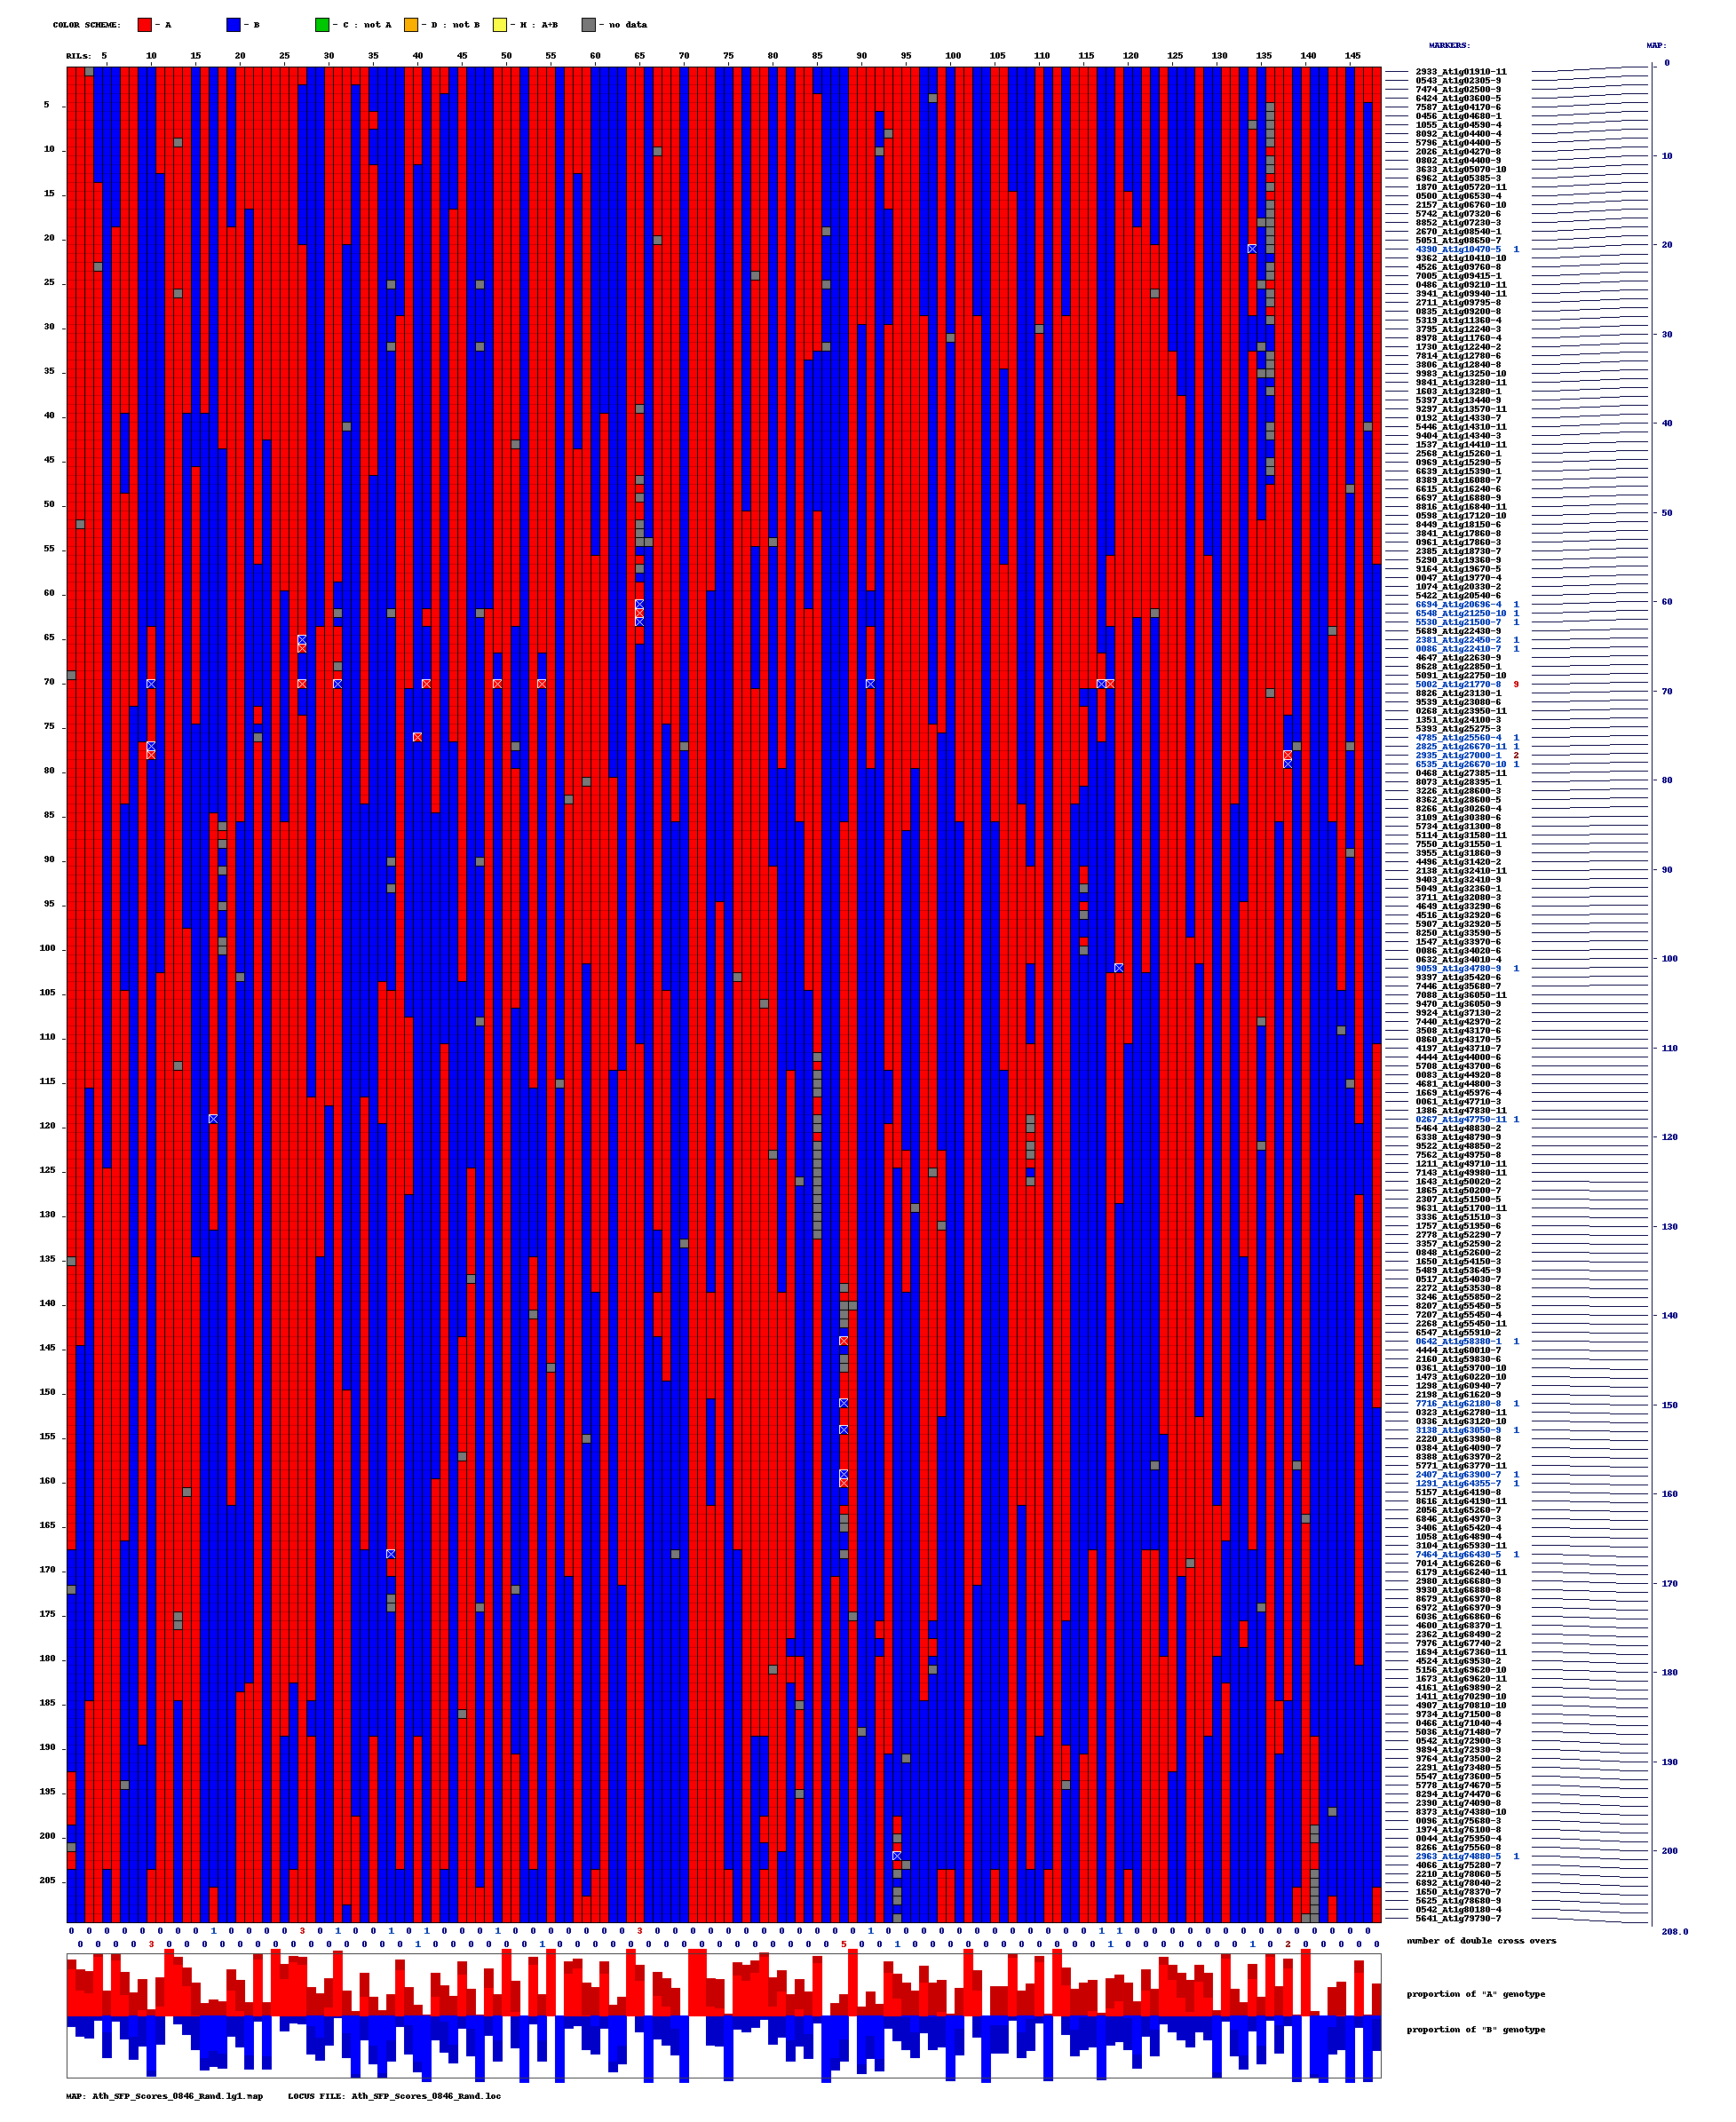
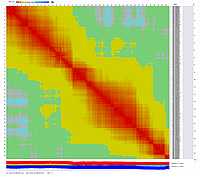
Visualization of constructed genetic maps using CheckMatrix:
(note, remove/delete first header line from any *.mad_map_final file to use it with CheckMatrix)
Linkage Group I

|
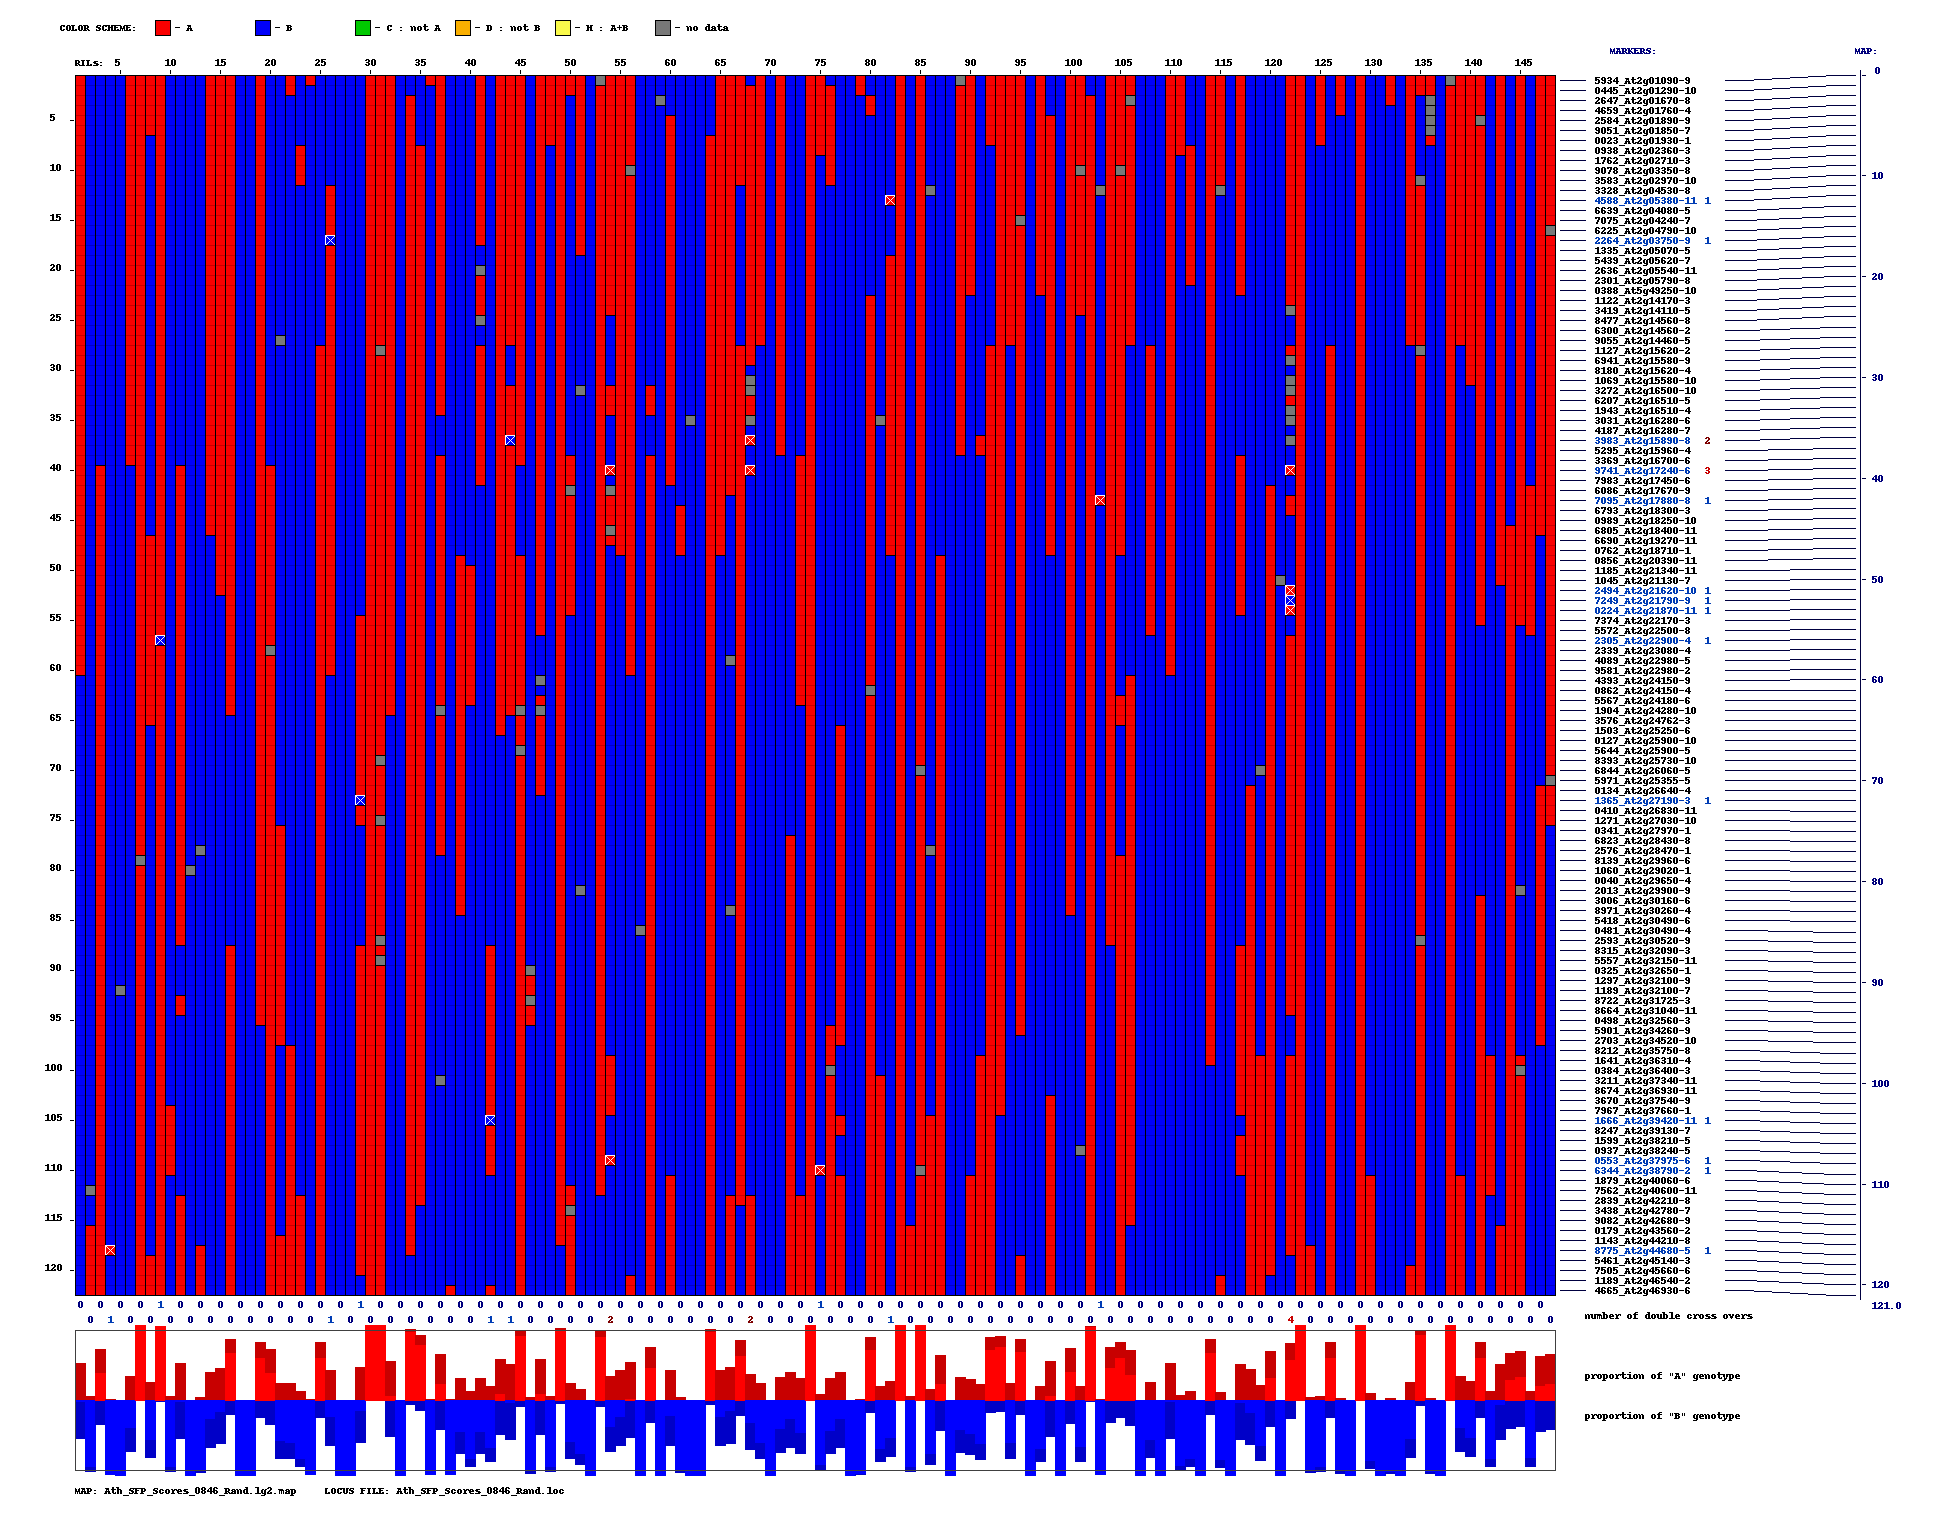
Linkage Group II
|
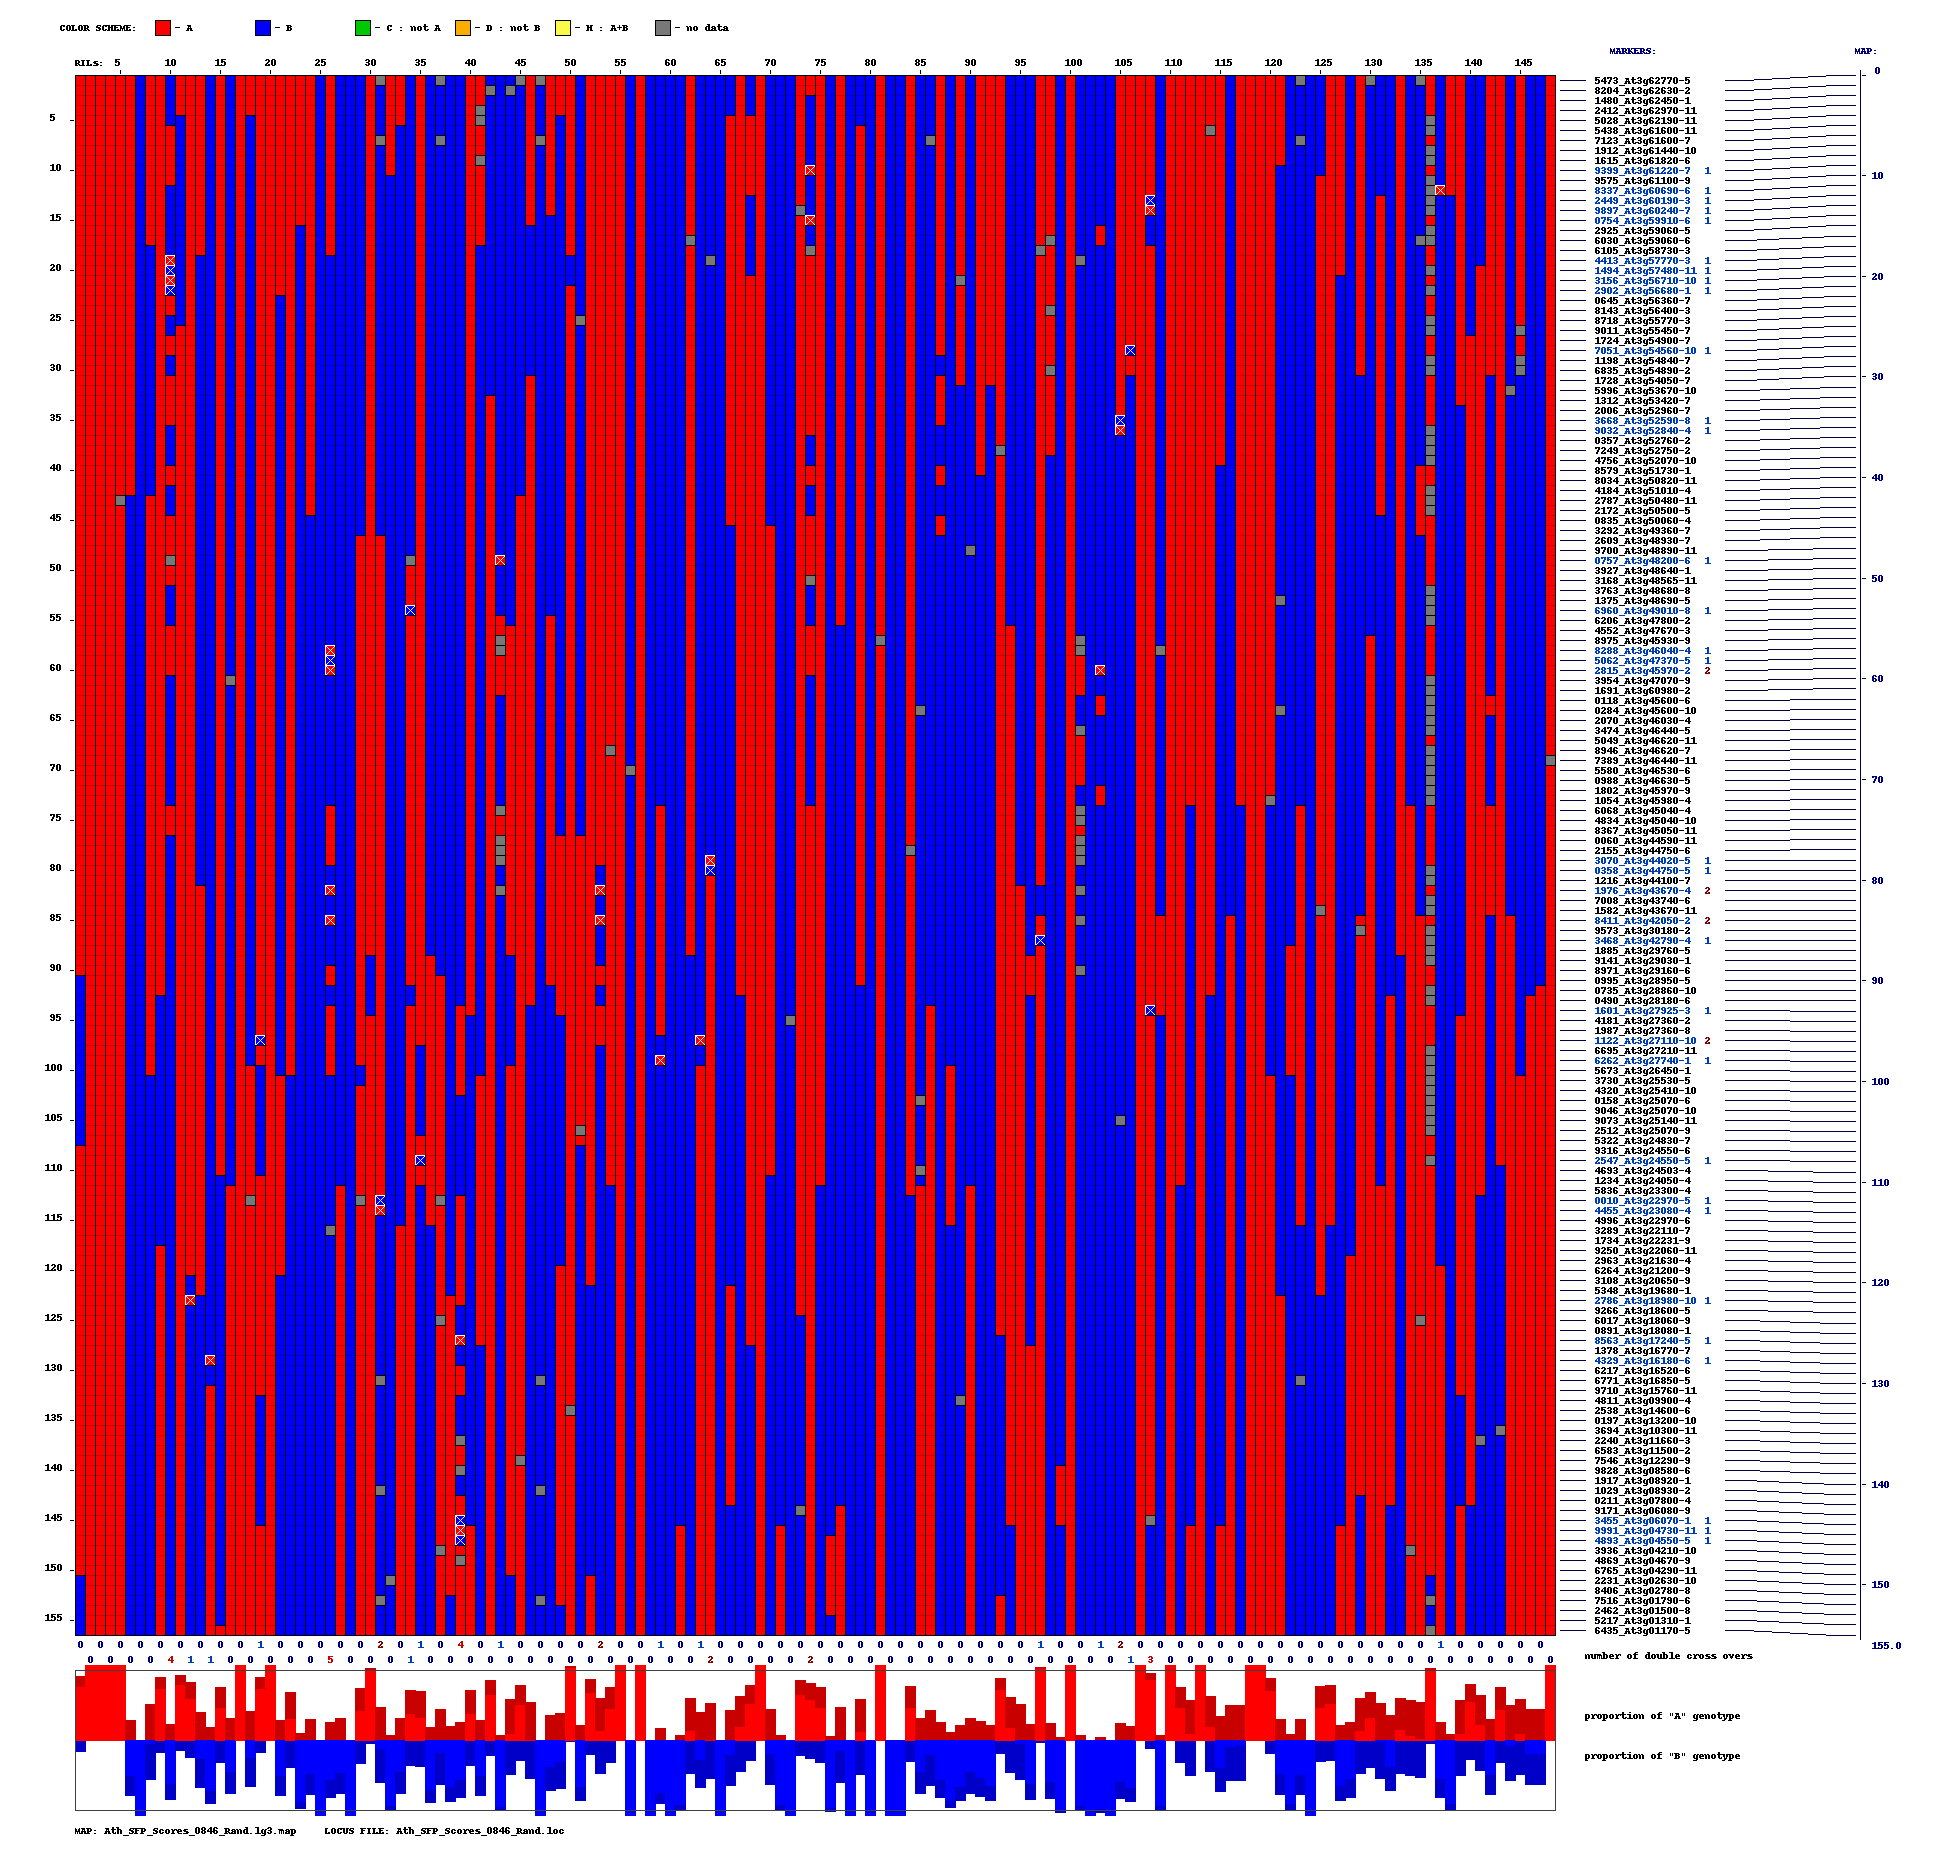
Linkage Group III
|
Linkage Group IV
|
Linkage Group V
|
|
|
|
|
|
|
|
|
|
|
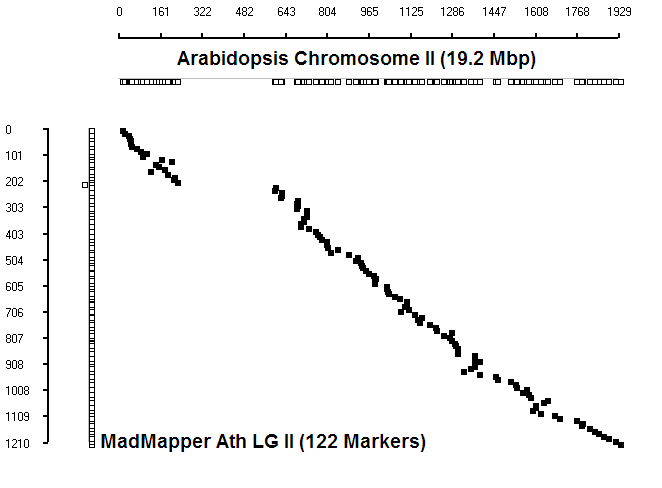
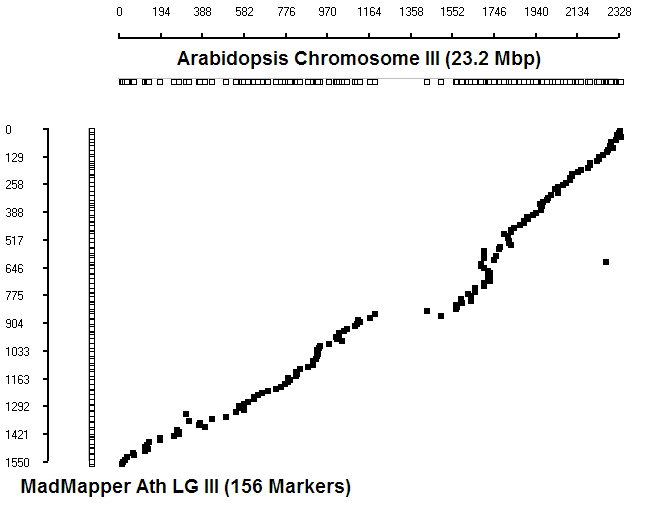
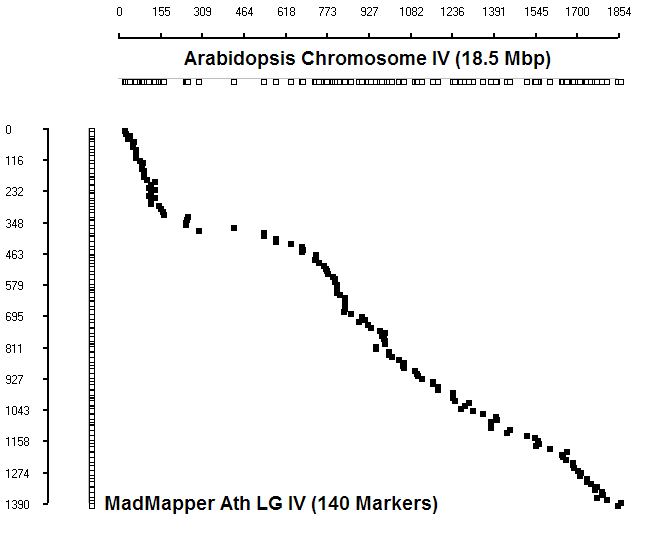
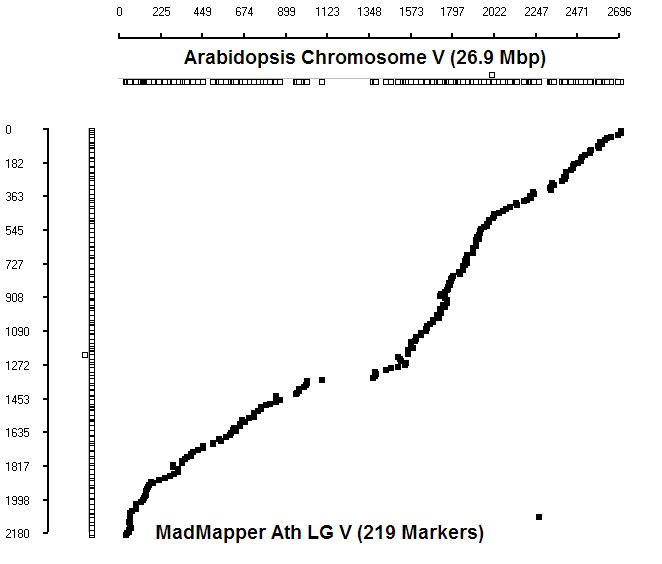
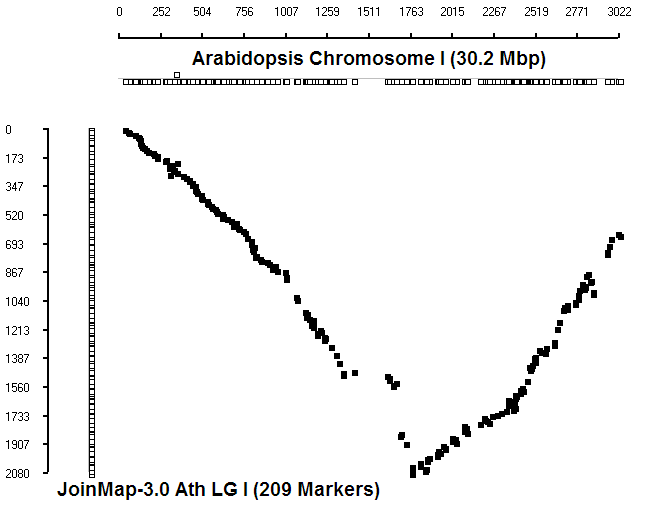
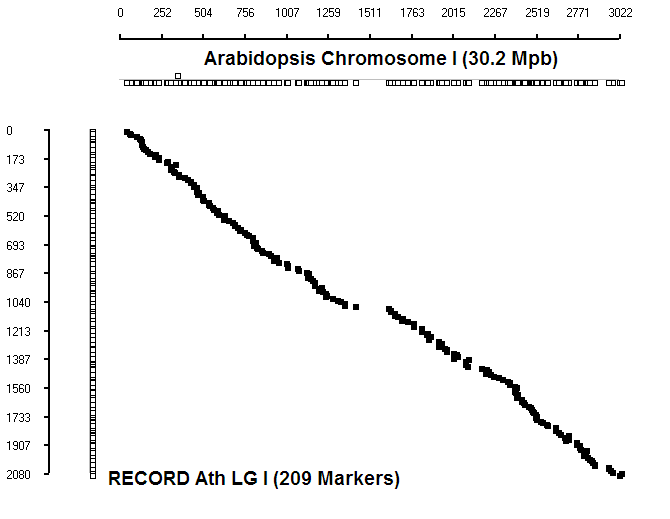
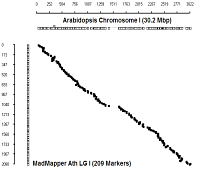
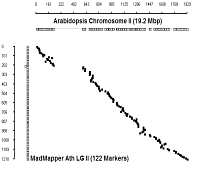
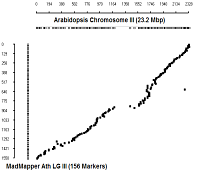
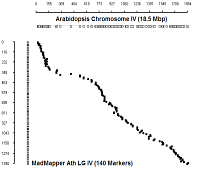
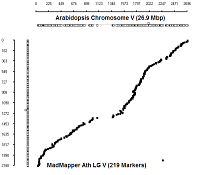
Comparison with physical coordinates of genes on Columbia genotype
Ath Chromosome I
|
Ath Chromosome II
|
Ath Chromosome III
|
Ath Chromosome IV
|
Ath Chromosome V
|
diagonal dot plots were generated using GenoPix_2D_Plotter
Comparison with other methods/software to construct genetic map (example for linkage group 1):
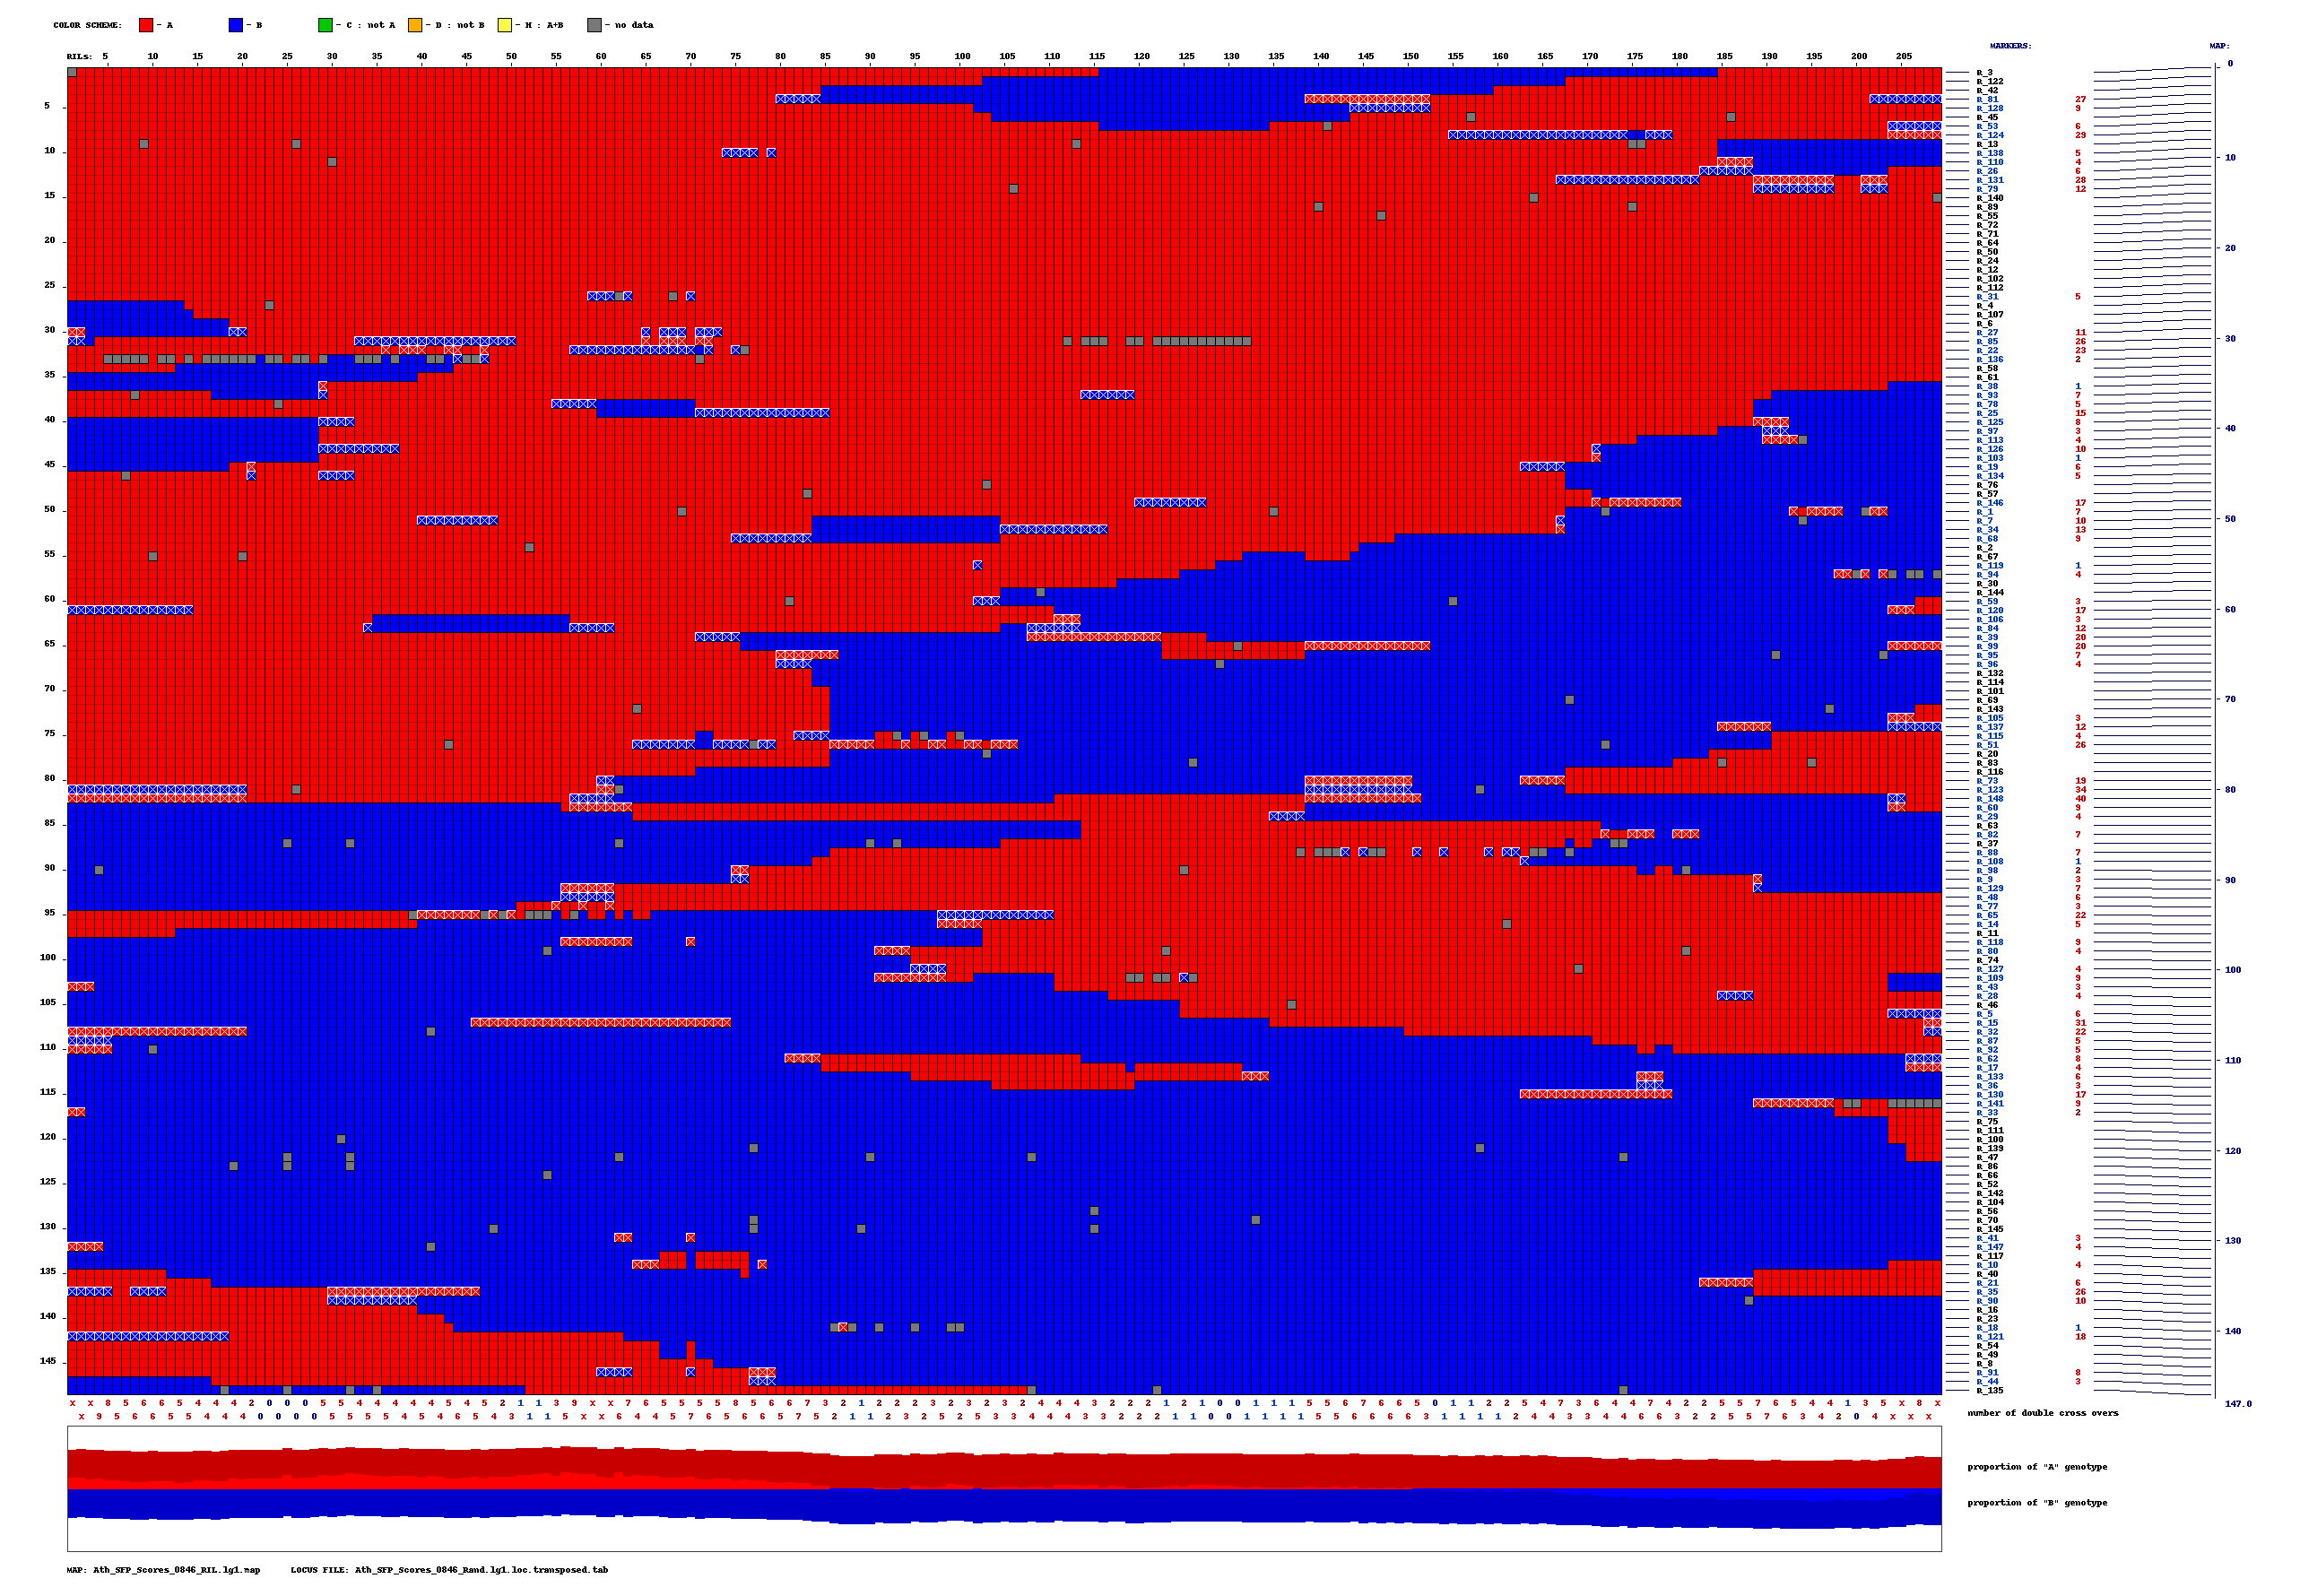
RIL CLUSTERING (example for linkage group I):
Transposed locus file
Ath_SFP_Scores_0846_Rand.lg1.loc.transposed.tab
is derived from
Ath_SFP_Scores_0846_Rand.lg1.map.loc
locus file for linkage group I by transposition - 'rotation' of data using MS Excel that converted all columns into rows
and all rows into columns.
RILs were clustered using Python_MadMapper_V248_RECBIT_012NR.py script:
Ath_SFP_Scores_0846_Rand.lg1.loc.transposed.out020.x_tree_clust
Ath_SFP_Scores_0846_Rand.lg1.loc.transposed.out020.pairs_all
Ath_SFP_Scores_0846_Rand.lg1.loc.transposed.out020.x_log_file
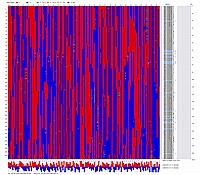
Results of RIL clustering/grouping were visualized using CheckMatrix:
ten 'frame' RILs were selected:
Ath_SFP_Scores_0846_Rand.lg1.loc.transposed.xclust.frame
and list of RILs 'to map' was compiled:
Ath_SFP_Scores_0846_Rand.lg1.loc.transposed.xclust.list.sorted
Then RILs were 'mapped' using Python_MadMapper_V248_XDELTA_115.py script:
python Python_MadMapper_V248_XDELTA_115.py Ath_SFP_Scores_0846_Rand.lg1.loc.transposed.out020.pairs_all Ath_SFP_Scores_0846_Rand.lg1.loc.transposed.xclust.list.sorted Ath_SFP_Scores_0846_Rand.lg1.loc.transposed.xclust.frame Ath_SFP_Scores_0846_Rand.lg1.loc.transposed.xclust.xdelta_S 1 FLEX SHUFFLE 6 3 &
Ath_SFP_Scores_0846_Rand.lg1.loc.transposed.xclust.xdelta_S.mad_map_final was generated, re-named into
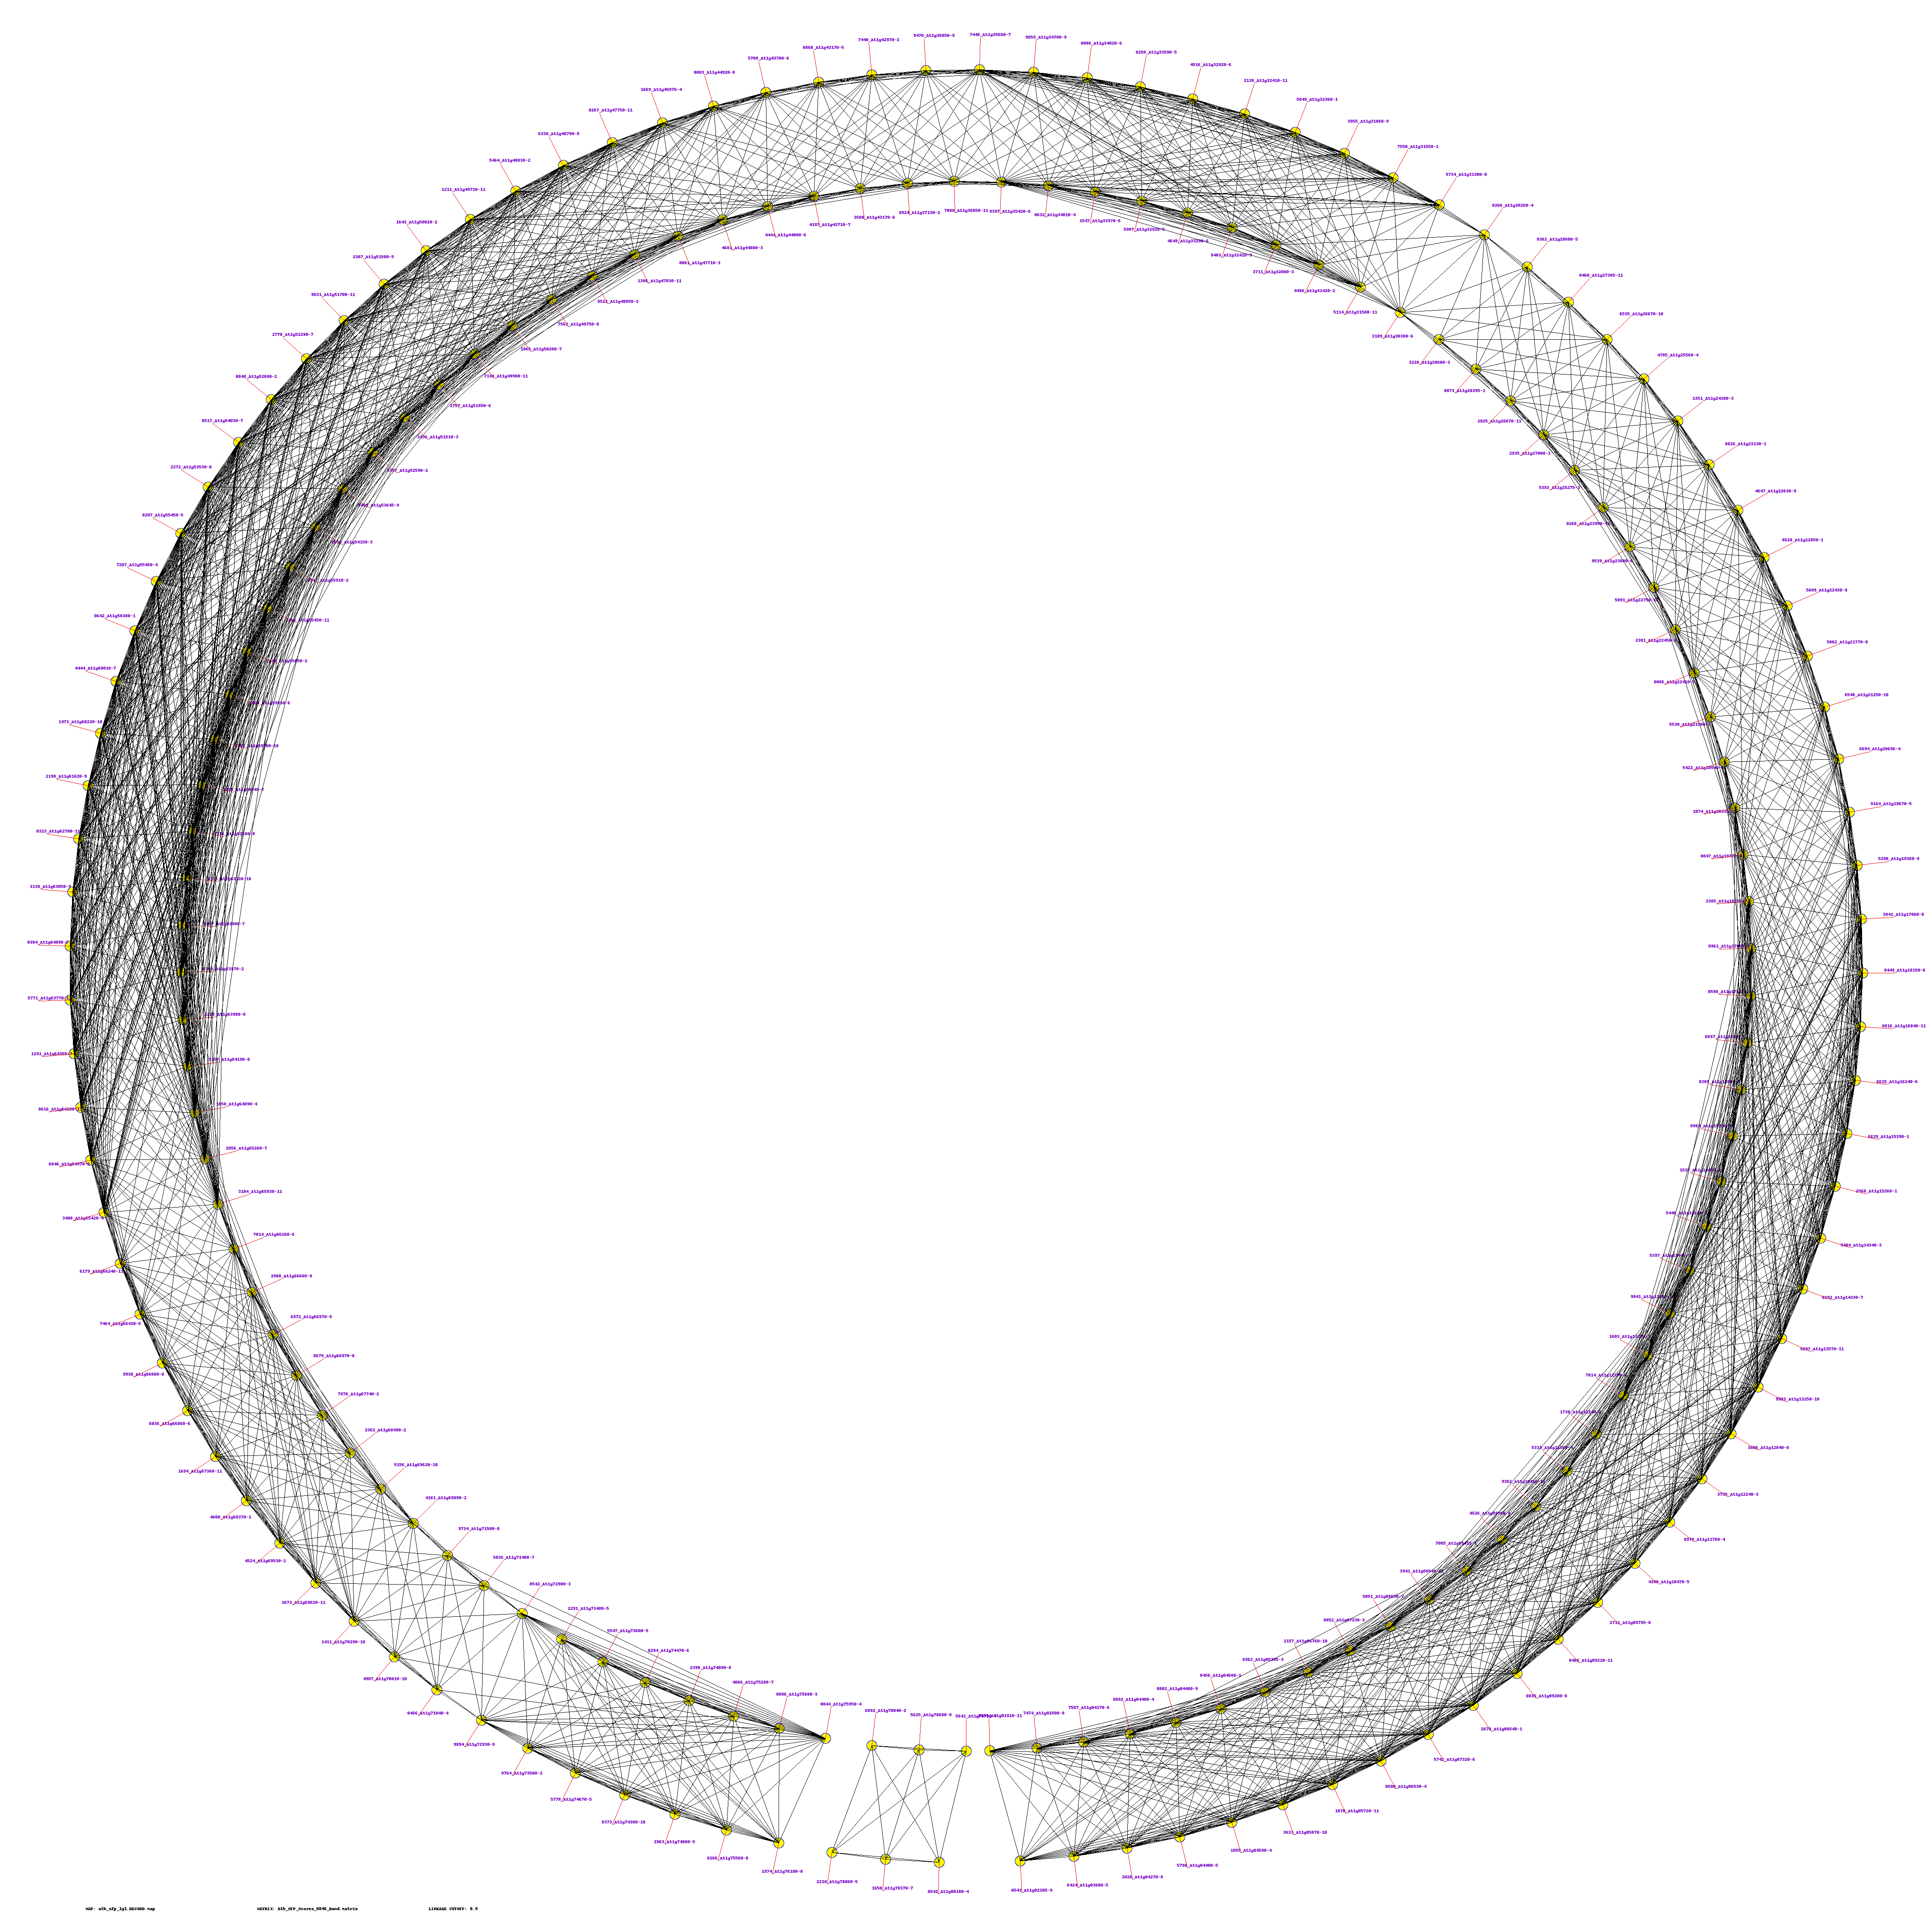
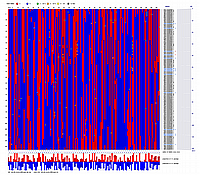
Ath_SFP_Scores_0846_RIL.lg1.map and visualized with CheckMatrix:
new locus file was compiled where RILs are sorted according to their similarity (order derived by Python_MadMapper_V248_XDELTA_115.py):
Ath_SFP_Scores_0846_RIL.lg1.map.loc
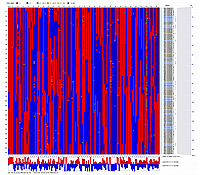
then Ath_SFP_Scores_0846_RIL.lg1.map.loc was transposed back to
Ath_SFP_Scores_0846_RIL.lg1.map.transposed.loc
file and visualized with CheckMatrix:
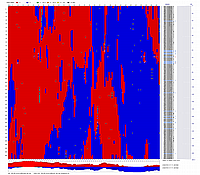
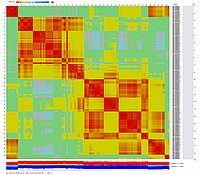
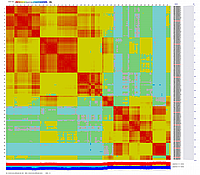
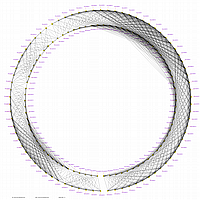
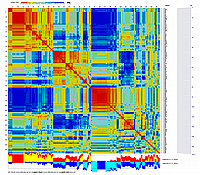
GLOBAL MAP:

GLOBAL_MAP_1
|
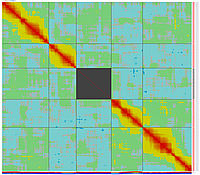
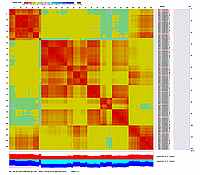
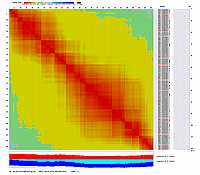
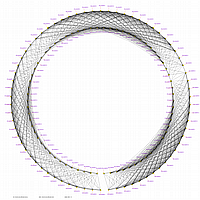
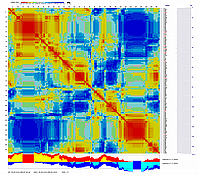
GLOBAL_MAP_2
|
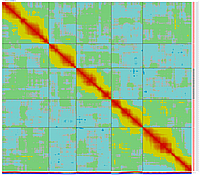
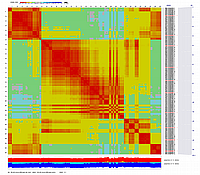
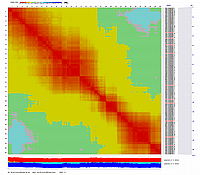
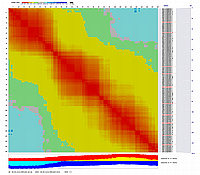
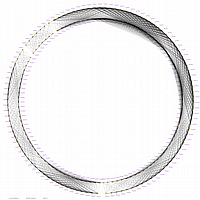
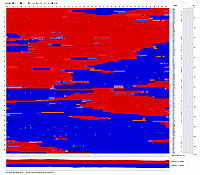
GLOBAL_MAP_3
|
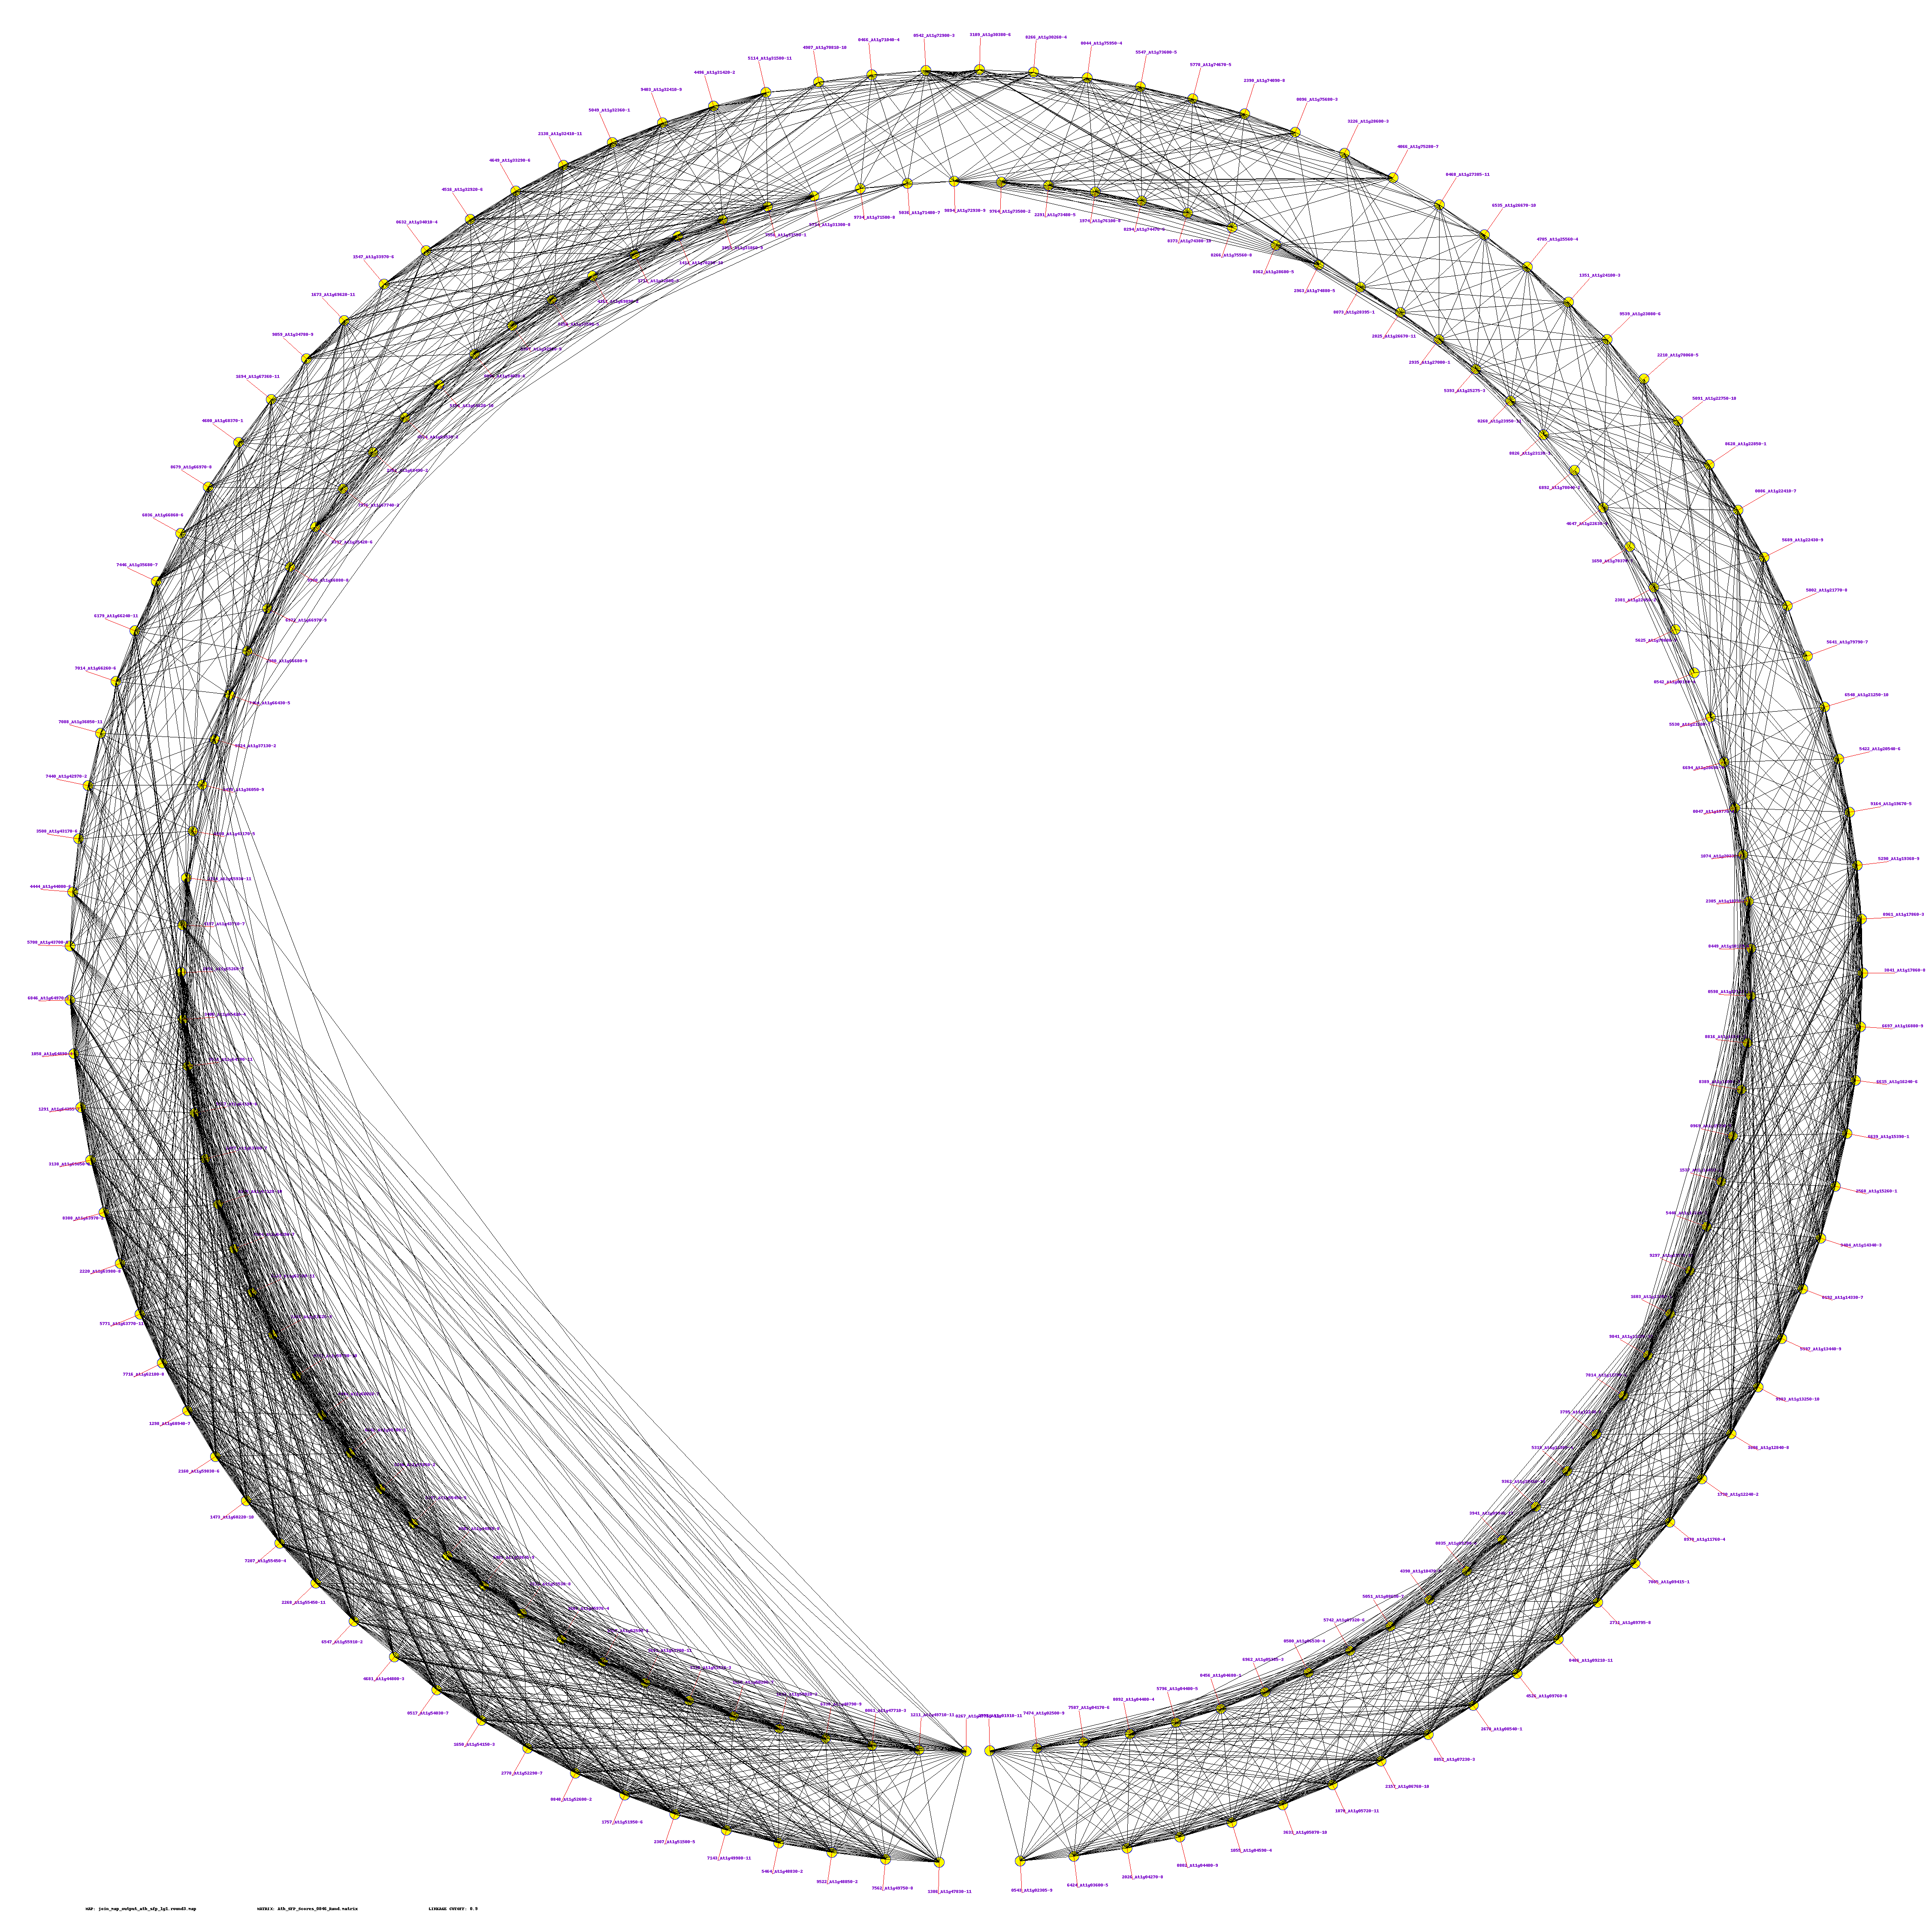
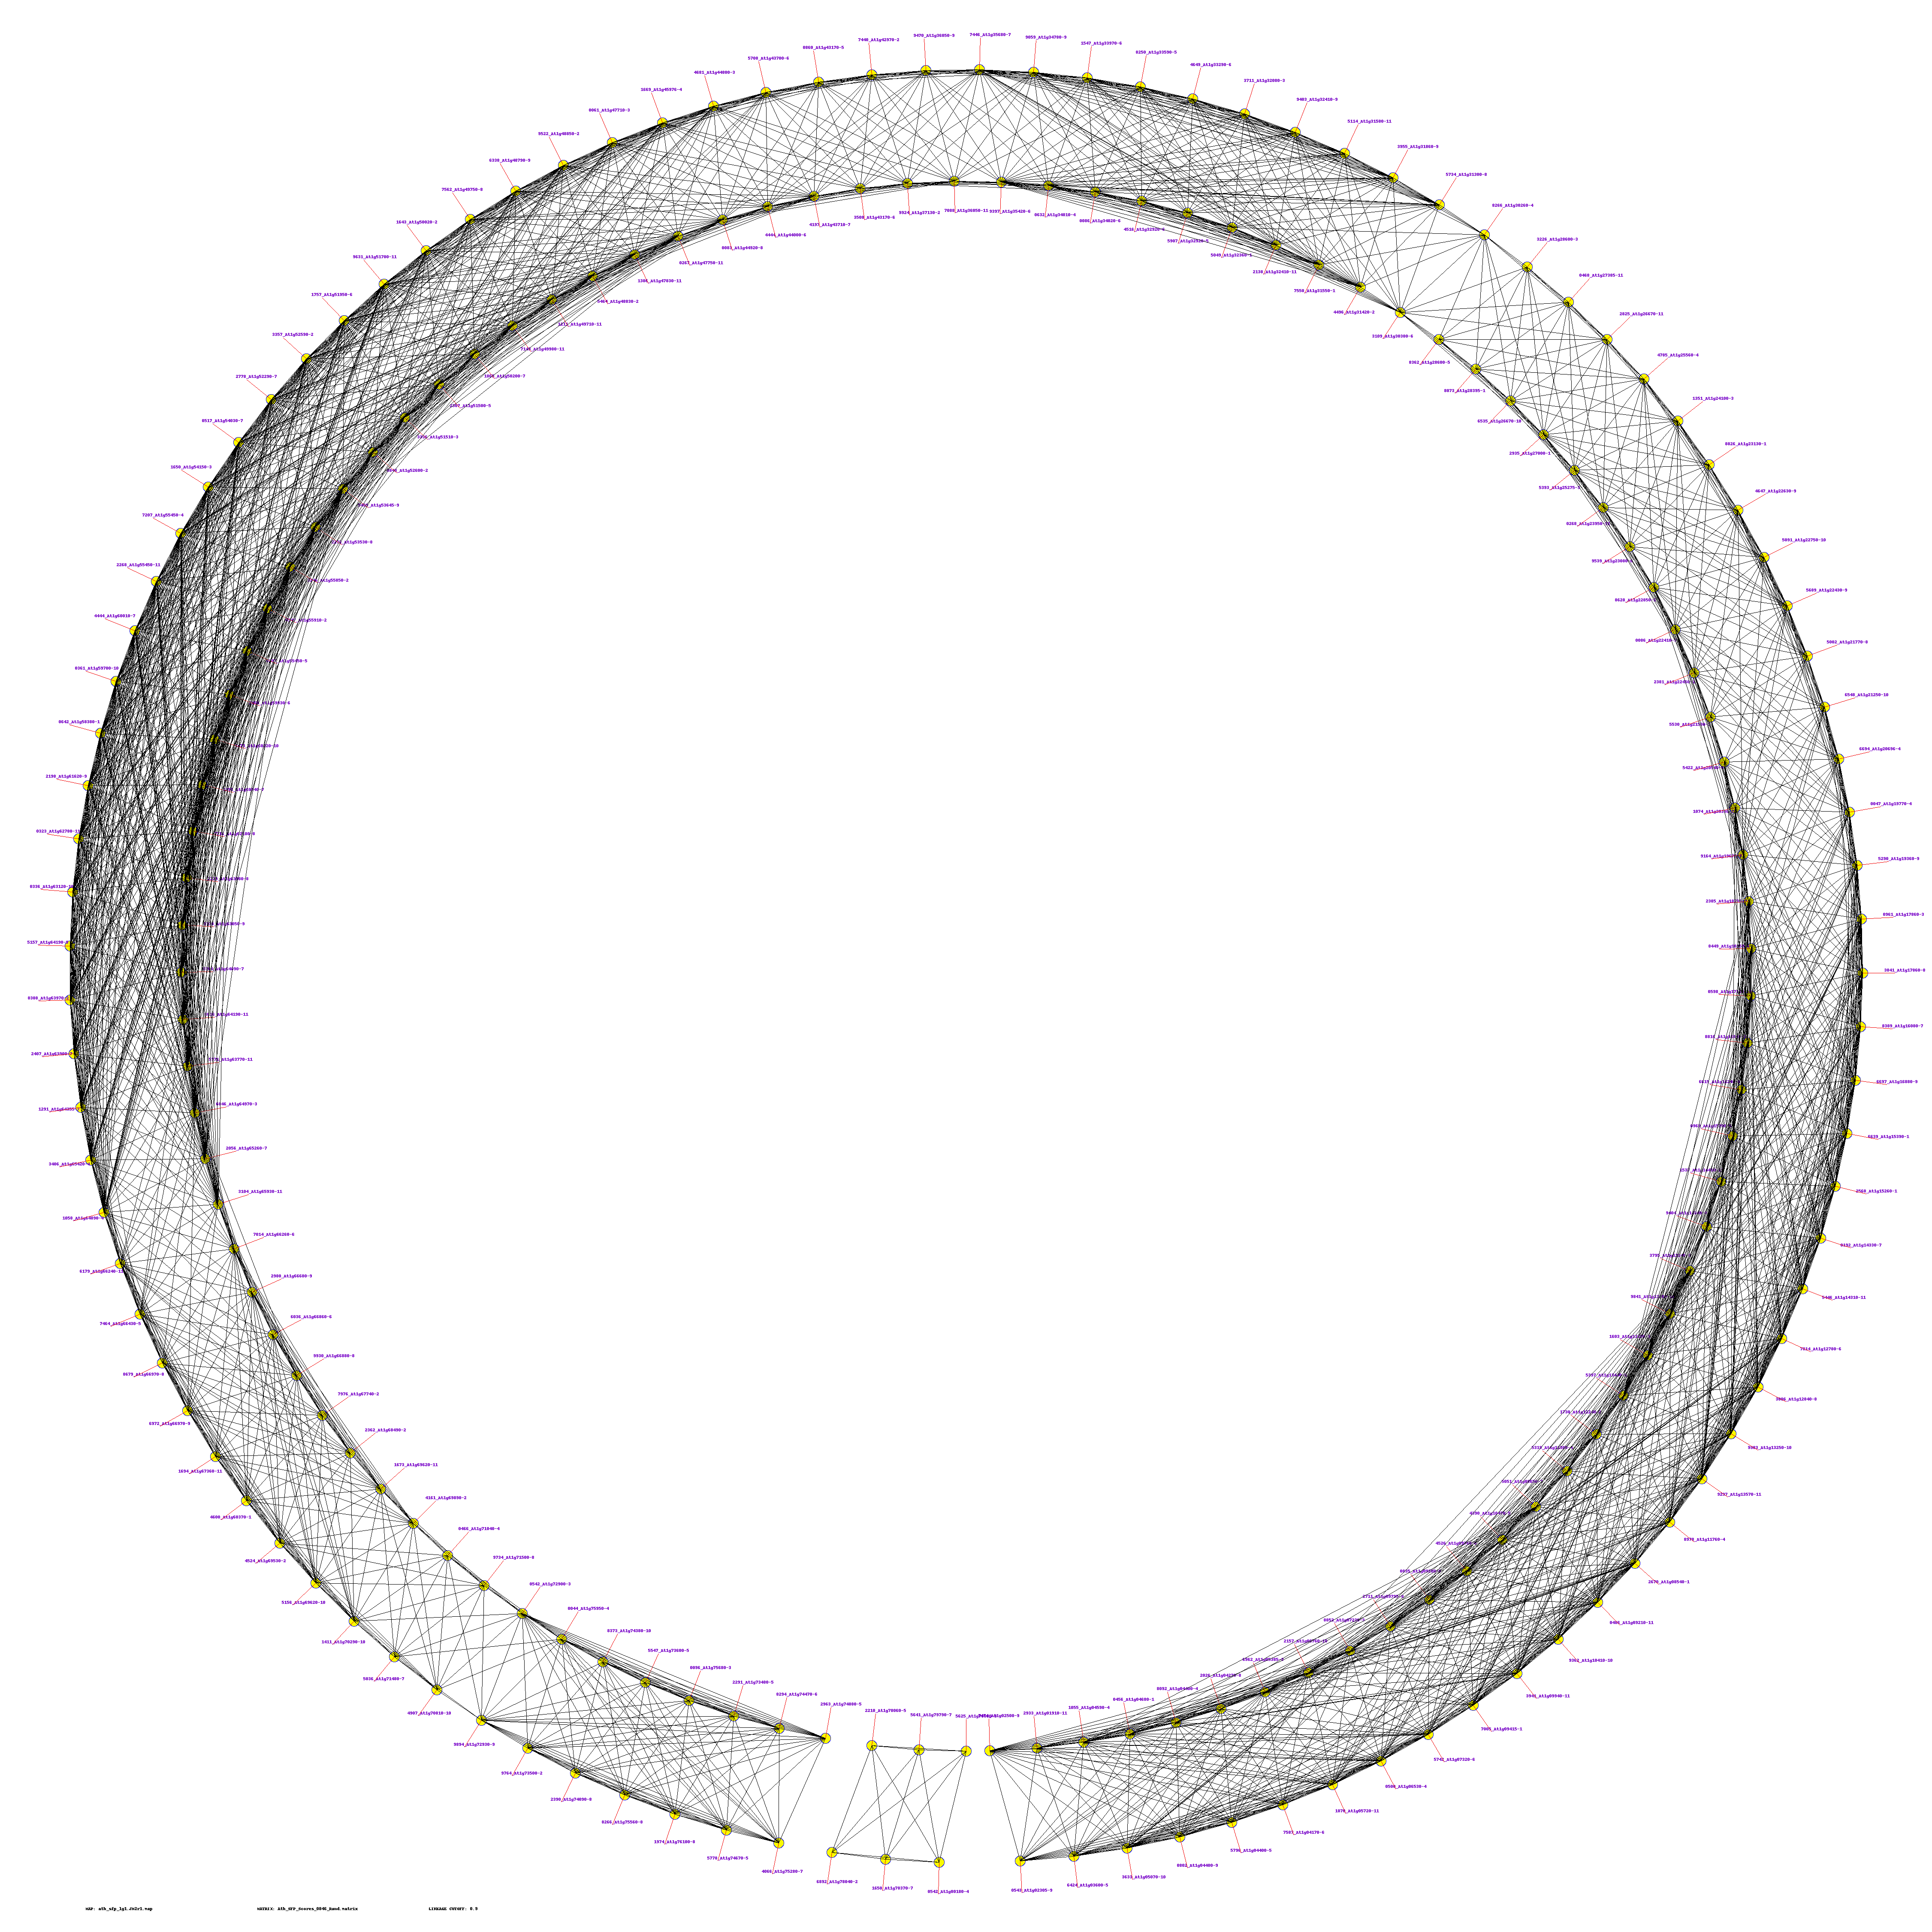
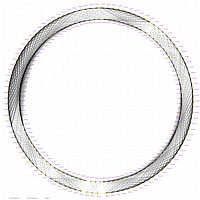
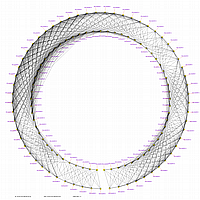
Minimum Entropy and Best-Fit Extension approach allows to infer linear order of markers without linkage data within selected linkage group. Linkage data between markers of different linkage groups are sufficient to find approximate order of markers. For example, it is possible to find an order of markers of Arabidopsis linkage group 3 based only on data of their interactions with other four linkage groups. See illustration of this approach above (GLOBAL_MAP_1, GLOBAL_MAP_2 and GLOBAL_MAP_3). All pairwise data for markers within linkage group 3 were removed from pairwise matrix file. Only their values between other linkage groups left. This so called 'minus three' matrix is visualized on figure GLOBAL_MAP_2. Framework markers with fixed order are highlighted by red on figure GLOBAL_MAP_2. Sixteen markers from linkage group 3 left to serve as initial positions for proper placing remaining 140 markers. Then MadMapper_XDELTA has found approximate positions for 140 markers of linkage group 3 based only on their interactions with other linkage groups. Resulted map is displayed on figure GLOBAL_MAP_3. Mapped markers of linkage group 3 based on their relationships with markers on linkage groups 1,2,4 and 5 are displayed by black color.
python Python_MadMapper_V248_XDELTA_115.py Ath_MadMap_Shuffle115_AllLG_M3.matrix Ath_MadMap_Shuffle115_AllLG_M3.list Ath_MadMap_Shuffle115_AllLG_M3.frame Ath_MadMap_Shuffle115_AllLG_M3.out 0 FIXED NOSHUFFLE 6 3
Input files:
Ath_MadMap_Shuffle115_AllLG_M3.matrix - matrix file with all pairwise data within linkage group 3 removed (see visualization of this matrix on GLOBAL_MAP_2 figure)
Ath_MadMap_Shuffle115_AllLG_M3.list - list of markers to map
Ath_MadMap_Shuffle115_AllLG_M3.frame - framework map with fixed order
Output files:
Ath_MadMap_Shuffle115_AllLG_M3.out.mad_map_final - map output file
Ath_MadMap_Shuffle115_AllLG_M3.out.mad_map_log - log file with run parameters
email to: akozik@atgc.org Alexander Kozik
last modified July 04 2006