UC Davis
Clustering visualization using PhyloGrapher
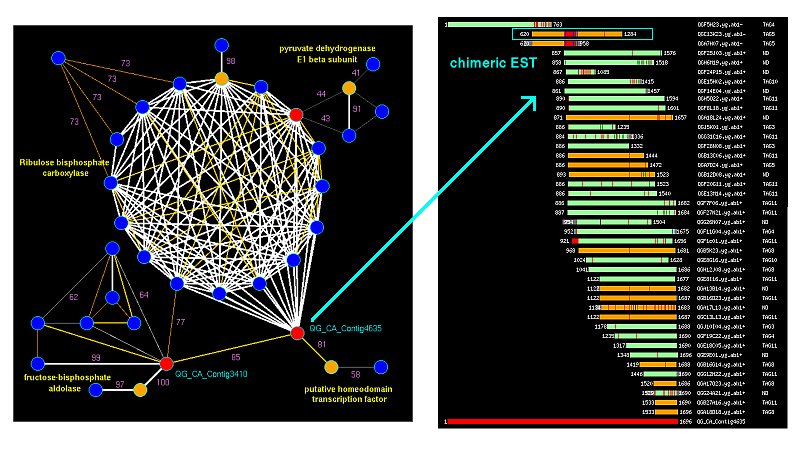
PhyloGrapher takes as an input "Matrix" file derived from the results of BLAST search and displays all BLAST hits between pairs of genes (nodes) graphically within defined cutoff values. Bridges were identified with the Graph9 program. The contig was used as an example because it was misassembled due to chimeric EST (diplayed in the blue box). Check this example data at CGPDB.