UC Davis
Step 14: Graphical representation of detected polymorphic sites
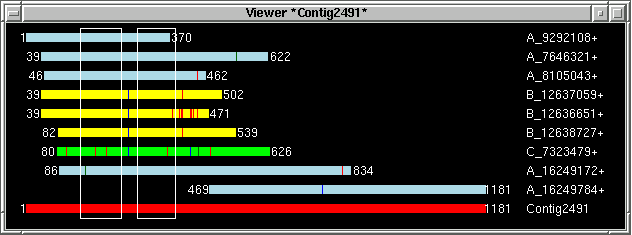
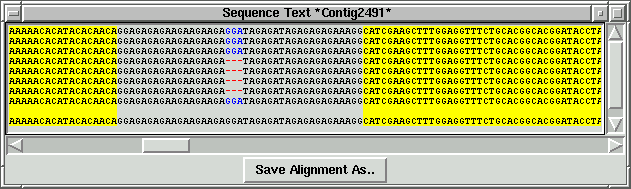
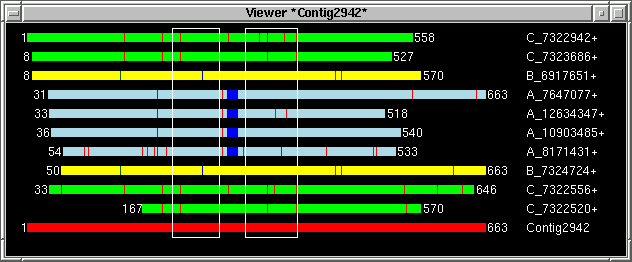
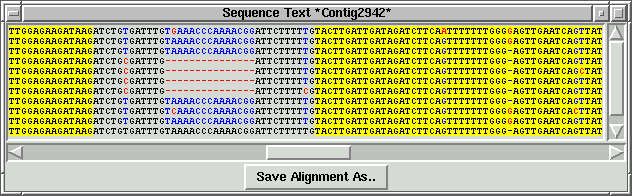
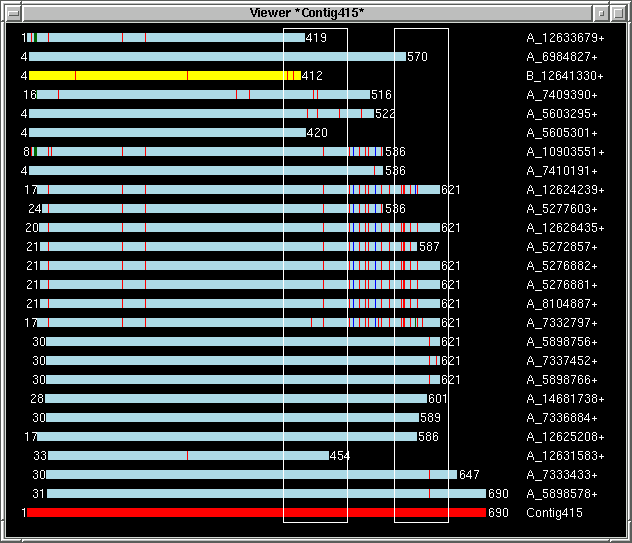
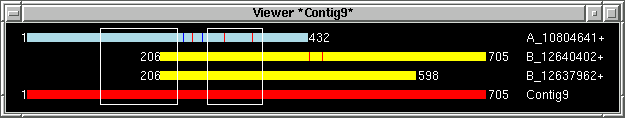
Selected contigs with polymorphic sites viewed using Py_ContigViewer.
Different genotypes are painted in different colors (lightblue, yellow and green horizontal bars)
Contig consensus is shown as red horizontal bar at the bottom of image. Blue vertical bars are
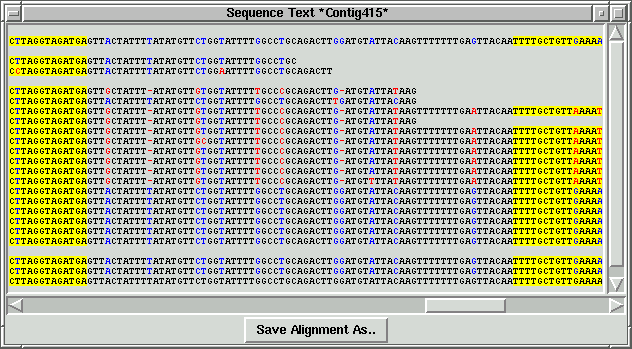
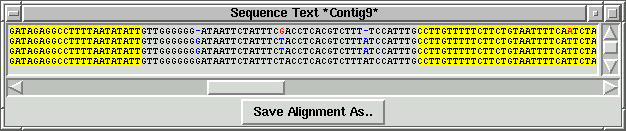
deletions, green vertical bars - insertions, red vertical bars - substitutions. Text windows display
information about assembly at nucleotide level.
Click here to find detailed
description of the Py_ContigViewer