|
GenomePixelizer
Genome Visualization tool: designed to display genomes in a linear form and show the relationships between genes. Example of usage: Arabidopsis segmental duplications and a list of other examples. |
PhyloGrapher
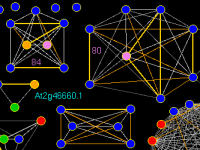
Graph Drawing tool: designed to visualize and study evolutionary relationships within families of homologous genes or proteins (elements). Example of usage: Graph of Arabidopsis thaliana cytochrome P450 genes. |
GenoPix_2D_Plotter
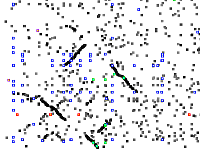
Genome Dot Plot tool: designed to generate images (interactive canvases) of genomic similarity dot plots, where each "dot" indicates similarity between a pair of genes. Example of usage: Arabidopsis genome dot plot. |
Python CAP3 Contig Viewer
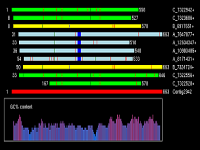
Contig Viewer: for visualization of details about EST (DNA) assembly. Contig Viewer provides functionality to design oligos (primers) for PCR reactions; it may work in conjunction with PerlPrimer. |
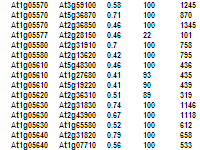
NCBI BLAST Parser
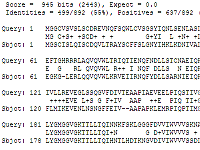
BLAST Parser: designed to process output files of the stand-alone NCBI BLAST program and generate numerous tab-delimited files with meaningful detailed information about DNA or protein sequence similarity/identity. Latest version is tcl_blast_parser_123_V025.tcl |
Graph9
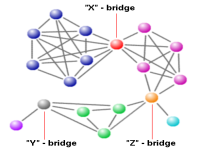
Graph Node Clustering Analysis: Graph9 program does clustering based on an adjacency matrix. Input files for Graph9 can be generated by BLAST Parser. Output files of Graph9 contain detailed information about gene clustering (grouping). |
GenBank Parser
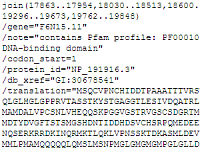
GenBank Parser is a Python script designed to translate the region of DNA sequence specified in the CDS part of each gene into a protein sequence. It also generates additional files that are designed to assist in GenBank data analysis. |
SNP Discovery
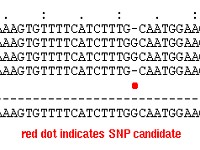
SNP Discovery Pipeline: designed to find SNP candidates in an EST CAP3 assembly. It works very efficiently if an assembly consist of ESTs from two or more different genotypes. It works in conjunction with Python Contig Viewer |
Sequence Extractor from BLAST report and Codon Usage Pipeline
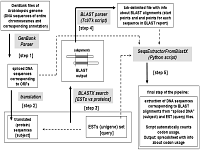
Codon Usage pipeline : The pipeline is a set of Python/Tcl-Tk scripts which extracts open reading frames (ORFs) from BLAST alignments generated by BLASTX search and counts codon usage. |
Zoomable Arabidopsis Genome 2D plot 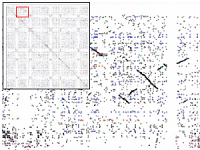
Zoom into a large (5,000 x 5,000 pixel) image of the Arabidopsis genome and explore segmental duplications. |
Arabidopsis Genome Dataset
Arabidopsis GenBank files for all 5 chromosomes were processed by Python GenBank Parser. Files which can be used as input files for GenomePixelizer and Genopix2D Plotter are available for download here. |
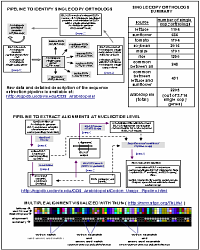
Arabidopsis Single Copy Genes Conserved Orthologs Canditates 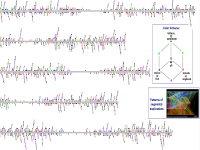 Database of Arabidopsis single copy genes
or so called COS (Conserved Orthologs Set). The image was created using GenomePixelizer.
Database of Arabidopsis single copy genes
or so called COS (Conserved Orthologs Set). The image was created using GenomePixelizer.
|
|
MadMapper BIT scoring system 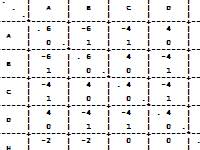
Python_MadMapper_RECBIT.py script was designed to calculate recombination scores for a set of RILs (Recombination Inbred Lines); it does group (clustering) analysis finding different linkage groups based on raw marker scores. |
CheckMatrix
Genetic Map 2D Matrix Plot (CheckMatrix) is a Python script designed to visualize and validate constructed genetic maps. It can use recombination or BIT scoring systems. It works in conjunction with the Python_MadMapper_RECBIT.py script. |
Genetic Map Raw Scores 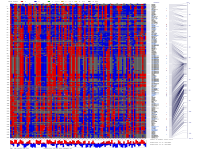
An extended version of CheckMatrix. This version allows to visualize and analyze distribution of raw score values on genetic maps; it counts and highlights double recombination events as well as display allele composition/distortion. |
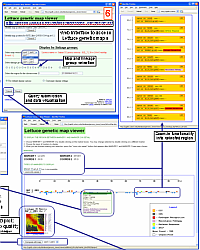
Zoomable Arabidopsis Genetic Map 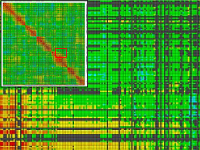
Zoom into a large (15,000 x 15,000 pixel) image of an Arabidopsis Genetic Map and explore regions with positive and negative linkage. |
|
MadMapper_XDELTA - inference of linear order of markers on linkage groups using Minimum Entropy Approach and Best-Fit Extension 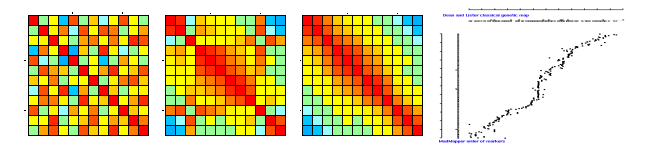
[ suite of Python MadMapper scripts for quality control of genetic markers, group analysis and inference of linear order of markers on linkage groups ] |
|||
TkLife
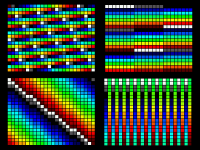
Multipurpose visualization program |
Decomposed Art

Visual experiments with TkLife |
Kanji
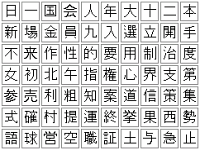
2,500 most frequently used kanji |
Universe Timeline
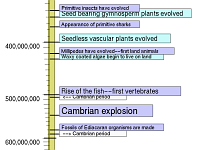
Python script to generate a poster-size image of the Universe Timeline on the logarithmic scale. |
On the nature of hereditary factors
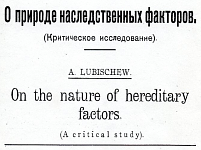
The work of Lubischew about the nature of the gene (1925). |
Photo Album
and
Watercolor Works

Photo pictures taken by the webmaster (me) of this website and Watercolor Works |
Book Shelf
My bookshelf |
Geolocate
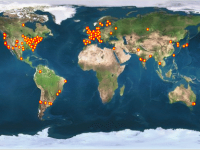
IP geolocator |
|
Posters at Plant, Animal & Microbe Genomes Conferences 2002-2005: |
|||
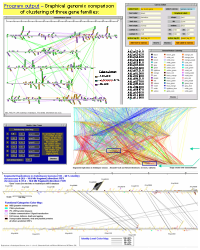 GenomePixelizer - a visualization tool for comparative genomics within and between species |
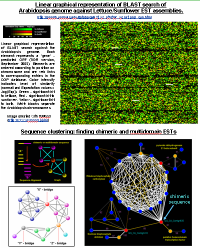 Lettuce/Sunflower EST CGPDB project. Data analysis, assembly visualization and validation |
 Analysis and visualization of single copy orthologs in Arabidopsis, lettuce, sunflower and other plant species |
 High-throughput mapping pipeline of EST based sequences on lettuce genome. Genetic map validation, visualization and Web presentation |
|
Visualization tools for studying ESTs, conserved orthologous sequences, and multigene families (overview of ContigViewer, GenomePixelizer and GenoPix_2D Plotter, 2002-2004) |
|||
|
Genetics of autoimmune diseases (systemic lupus erythematosus) in human. Transmission - Disequilibrium Test as a tool to detect linkage (association) between complex disease and a genetic markers. (overview of research projects 1991-2000) |
|||
|
List of publications where ATGC.org software have been used for the scientific data visualization Click Here |
|||
|
collection of web links: |
|||
|
Bioinformatics on the Web |
CyberSpace |
Das Glasperlenspiel |
ATGC.org old entry page |